Fig. 2.
Download original image
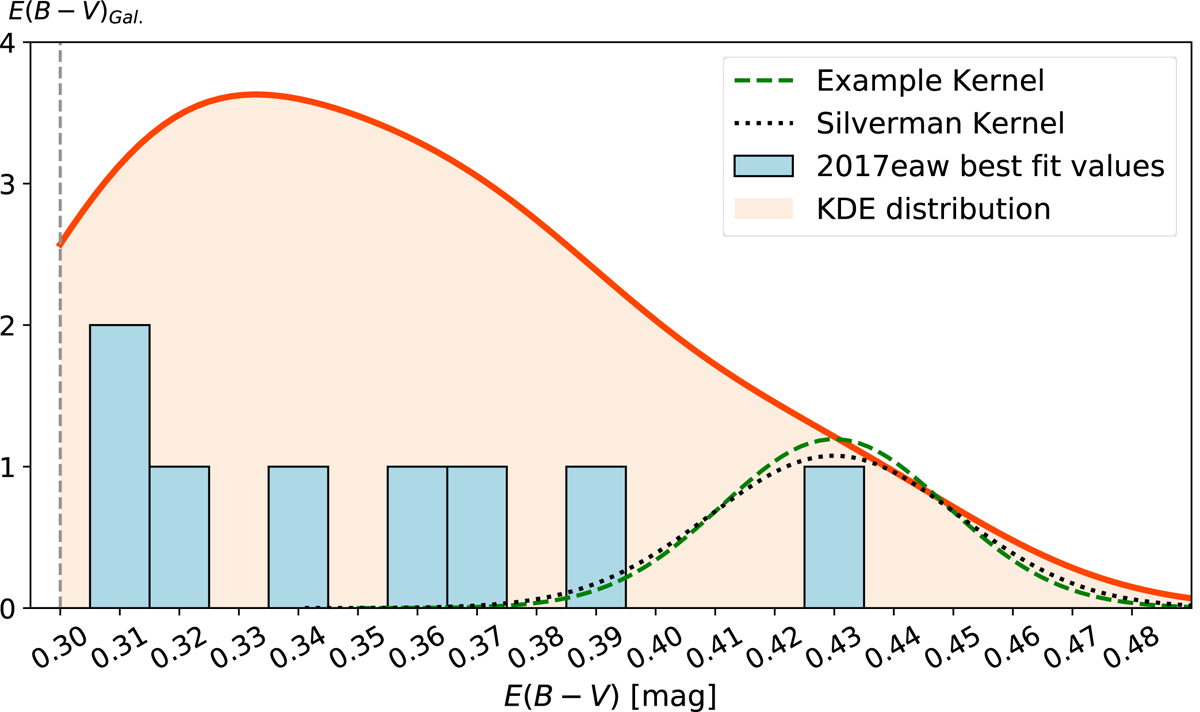
Distribution of best-fitting reddening estimates for all the epochs of SN 2017eaw (blue bars) and the constructed KDE distribution (background shape). Dashed grey line at E(B − V) = 0.3 mag denotes the Galactic reddening towards NGC 6946 based on the Schlafly & Finkbeiner (2011) dust map, which sets the lower limit for the KDE. The green and grey curves show the Gaussian kernels for a single observation obtained by our setting and Silverman’s rule, respectively. A normalisation procedure was applied to the KDE histogram to obtain a better comparison. For more details on this supernova, see Sect. 4.4.
Current usage metrics show cumulative count of Article Views (full-text article views including HTML views, PDF and ePub downloads, according to the available data) and Abstracts Views on Vision4Press platform.
Data correspond to usage on the plateform after 2015. The current usage metrics is available 48-96 hours after online publication and is updated daily on week days.
Initial download of the metrics may take a while.