Fig. A.2.
Download original image
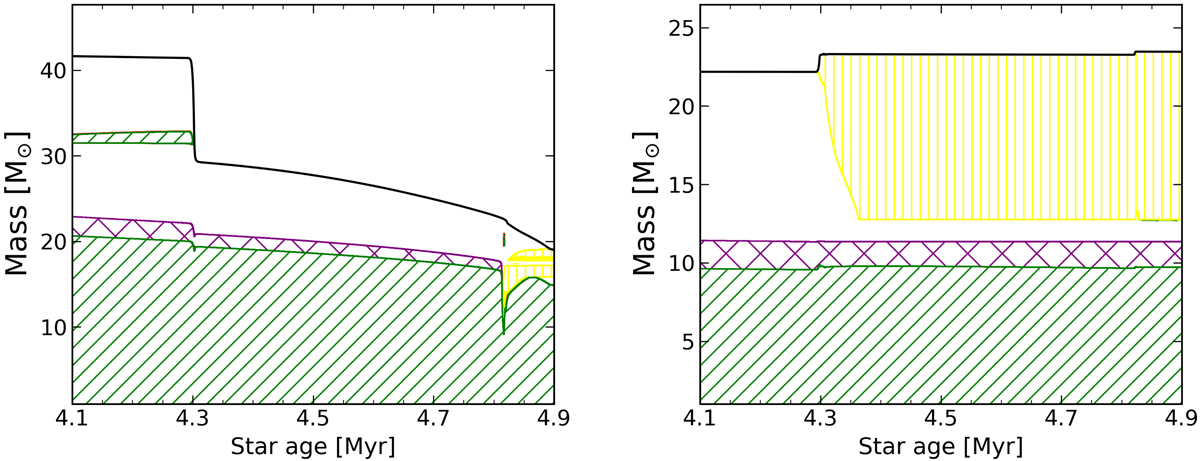
Kippenhahn diagram showing internal structure of the donor and accretor of the model with initial donor mass, mass ratio, and orbital period of 44.6 M⊙, 0.5, and 7.9 d, respectively, as a function of the stellar age. The green hatched line shows the regions of the star that are unstable to convection. The purple cross-hatched line shows the extent of convective overshooting above the convective core. The yellow hatching denotes the regions of thermohaline mixing. Red shows the regions of semi-convective mixing. The black line gives the total mass of the star as a function of stellar age.
Current usage metrics show cumulative count of Article Views (full-text article views including HTML views, PDF and ePub downloads, according to the available data) and Abstracts Views on Vision4Press platform.
Data correspond to usage on the plateform after 2015. The current usage metrics is available 48-96 hours after online publication and is updated daily on week days.
Initial download of the metrics may take a while.