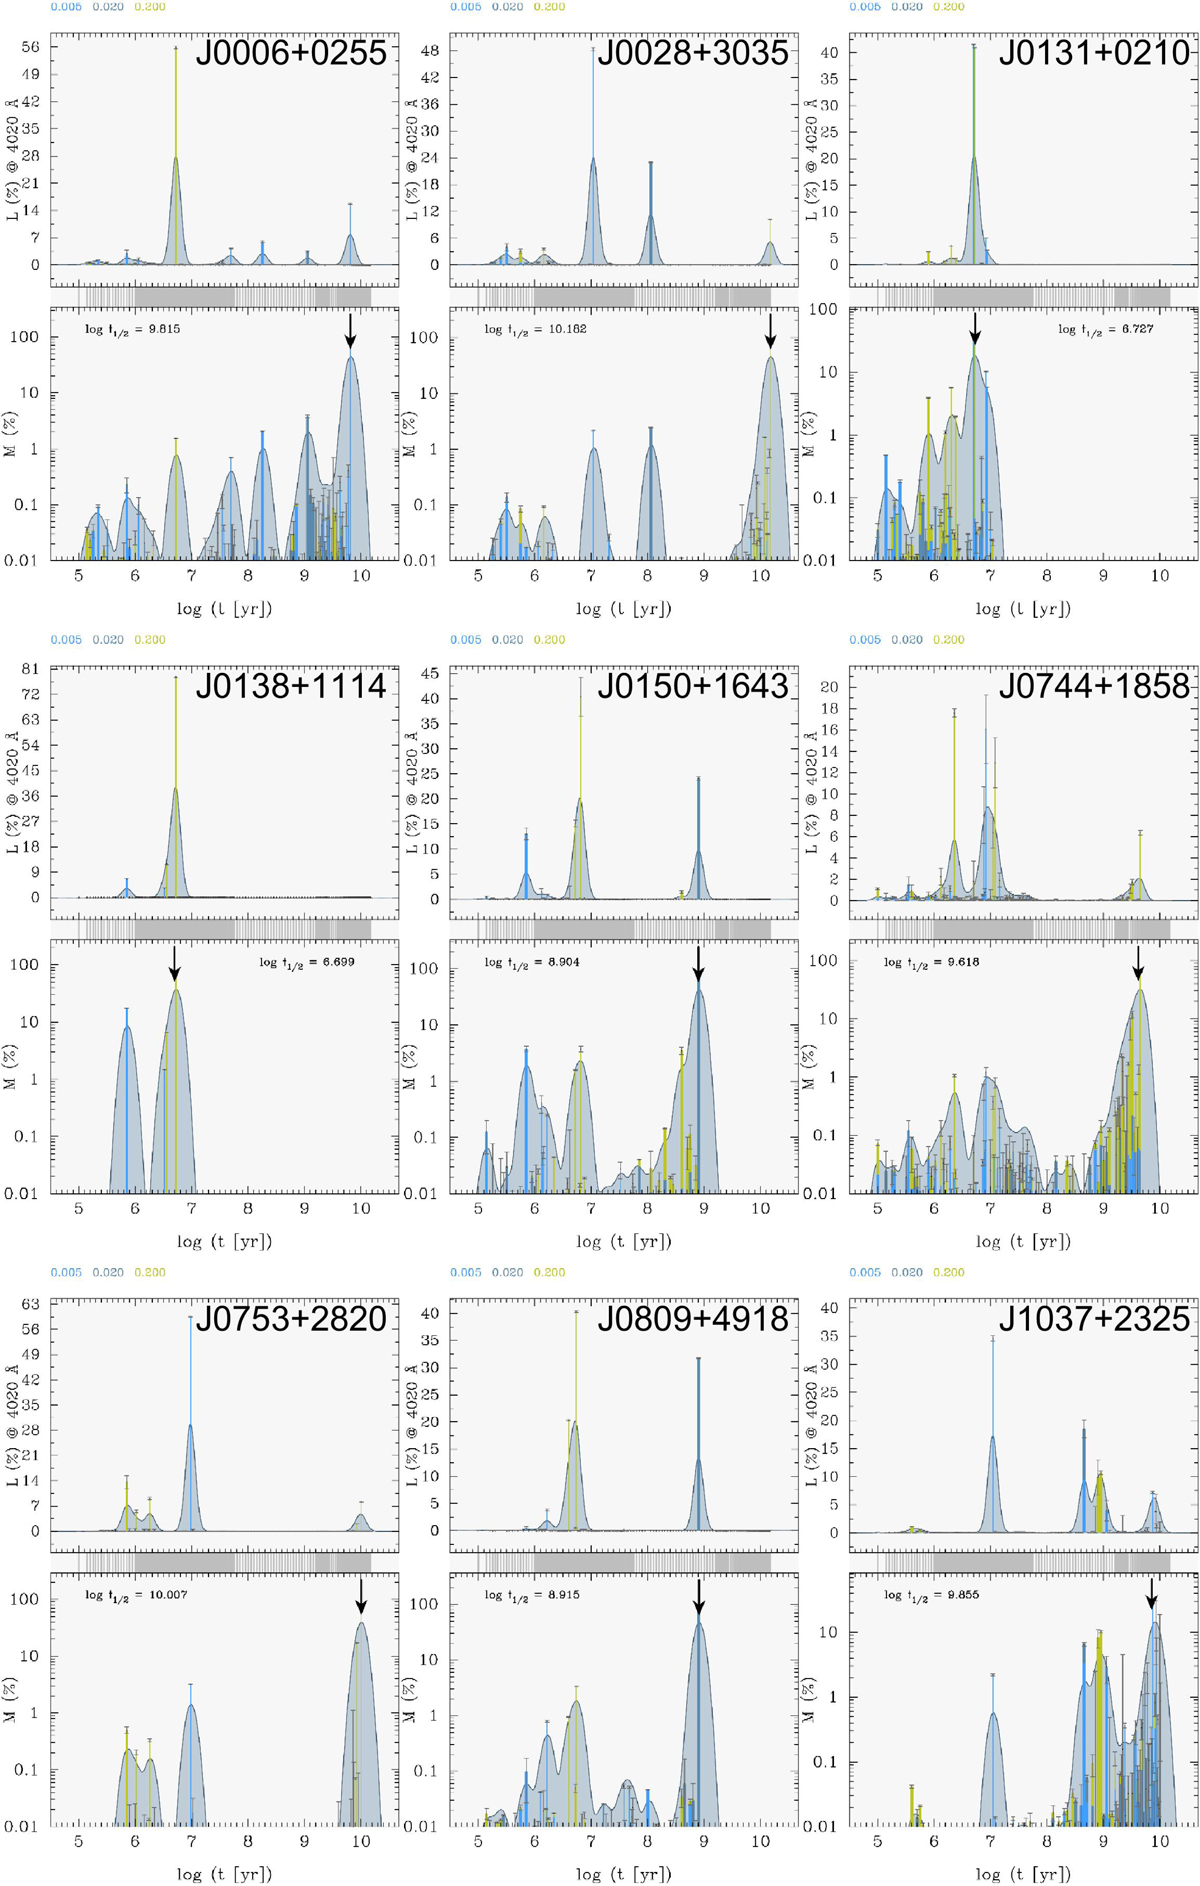
Fig. 9.
Download original image
SFHs of the first half of the IMPs. The top panel in each plot pair shows the SFH weighted by the stellar population’s luminosity at 4020 Å, whereas the bottom panel shows the mass-weighted SFH. Here, the black arrow marks the time where half of the galaxy’s mass was assembled, as indicated by the t1/2 inset. The bar colours correspond to the stellar metallicity as indicated by the numbers above each plot pair, in units of Z⊙.
Current usage metrics show cumulative count of Article Views (full-text article views including HTML views, PDF and ePub downloads, according to the available data) and Abstracts Views on Vision4Press platform.
Data correspond to usage on the plateform after 2015. The current usage metrics is available 48-96 hours after online publication and is updated daily on week days.
Initial download of the metrics may take a while.