Fig. A.7.
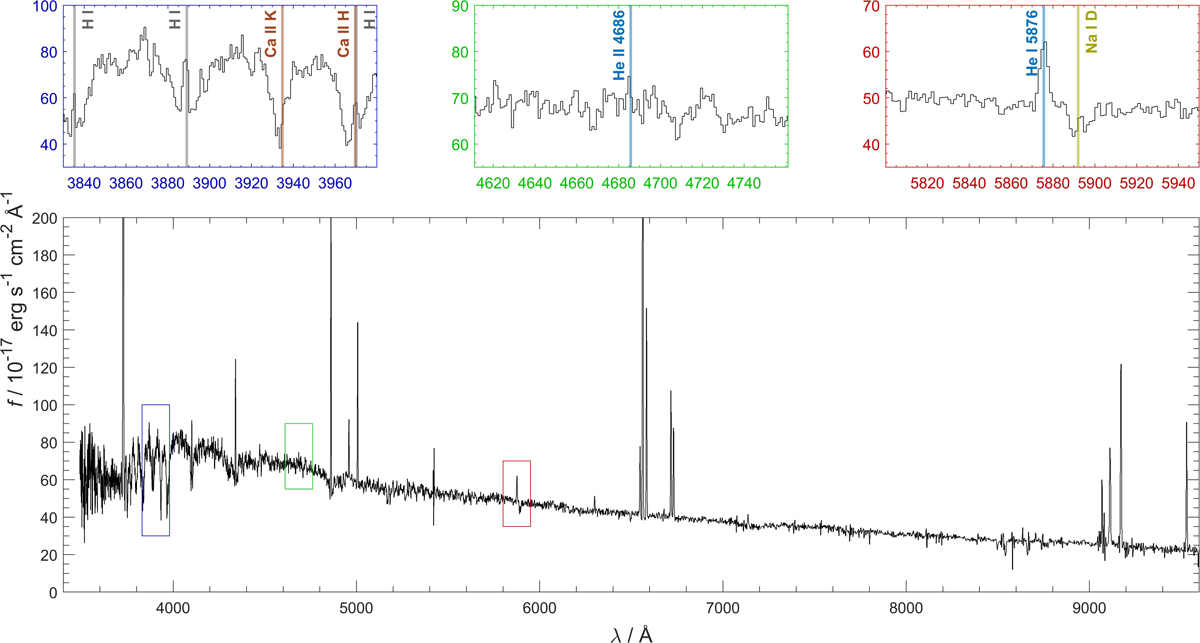
Download original image
3400 Å–9600 Å region of the redshift-corrected spectrum of J1657+4135, truncated in flux density f to enhance the visibility of weak spectral features (bottom row). The coloured boxes indicate the regions shown in the blow-ups in the top row and were selected to depict several features discussed in the text. The wavelengths were converted to vacuum wavelengths following Morton (1991).
Current usage metrics show cumulative count of Article Views (full-text article views including HTML views, PDF and ePub downloads, according to the available data) and Abstracts Views on Vision4Press platform.
Data correspond to usage on the plateform after 2015. The current usage metrics is available 48-96 hours after online publication and is updated daily on week days.
Initial download of the metrics may take a while.