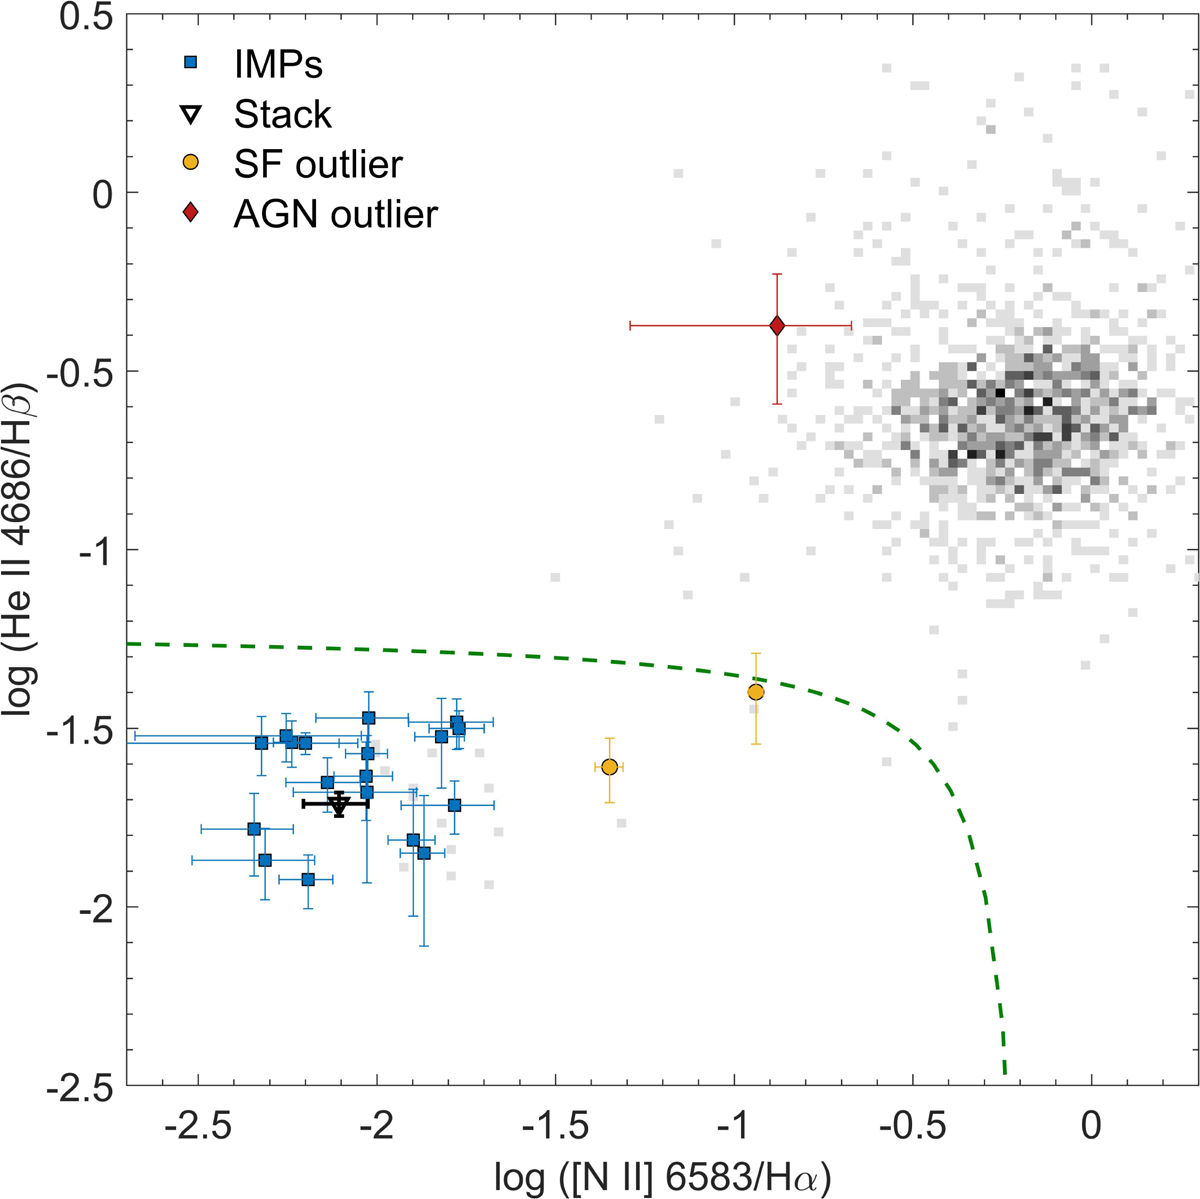
Fig. 2.
Download original image
Shirazi & Brinchmann (2012) diagram including their AGN diagnostic (green dashed line). Blue squares represent the IMPs, whereas the position of their stack is shown as a black downward-facing open triangle. Red diamonds and yellow circles mark the AGN contaminated galaxies and star-forming objects classified as outliers (see text). The grey scale density diagram represents all eligible galaxies from the SDSS DR12 with AoN > 2 in the utilised emission lines, binned in 0.02 × 0.02 dex bins for the line ratios shown. Lower contrast indicates lower bin occupancy.
Current usage metrics show cumulative count of Article Views (full-text article views including HTML views, PDF and ePub downloads, according to the available data) and Abstracts Views on Vision4Press platform.
Data correspond to usage on the plateform after 2015. The current usage metrics is available 48-96 hours after online publication and is updated daily on week days.
Initial download of the metrics may take a while.