Open Access
Fig. 12.
Download original image
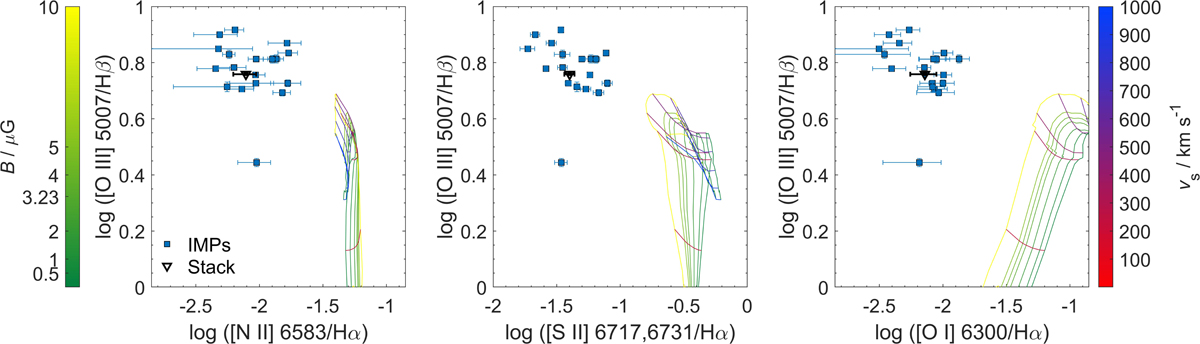
Three commonly used BPT diagrams for shock diagnostics; symbols are the same as in Fig. 2. Solid lines show the shock+precursor SMC model grids from Allen et al. (2008) with their parameters (shock velocity vs and transverse magnetic field B) coloured as indicated by the colour bars.
Current usage metrics show cumulative count of Article Views (full-text article views including HTML views, PDF and ePub downloads, according to the available data) and Abstracts Views on Vision4Press platform.
Data correspond to usage on the plateform after 2015. The current usage metrics is available 48-96 hours after online publication and is updated daily on week days.
Initial download of the metrics may take a while.