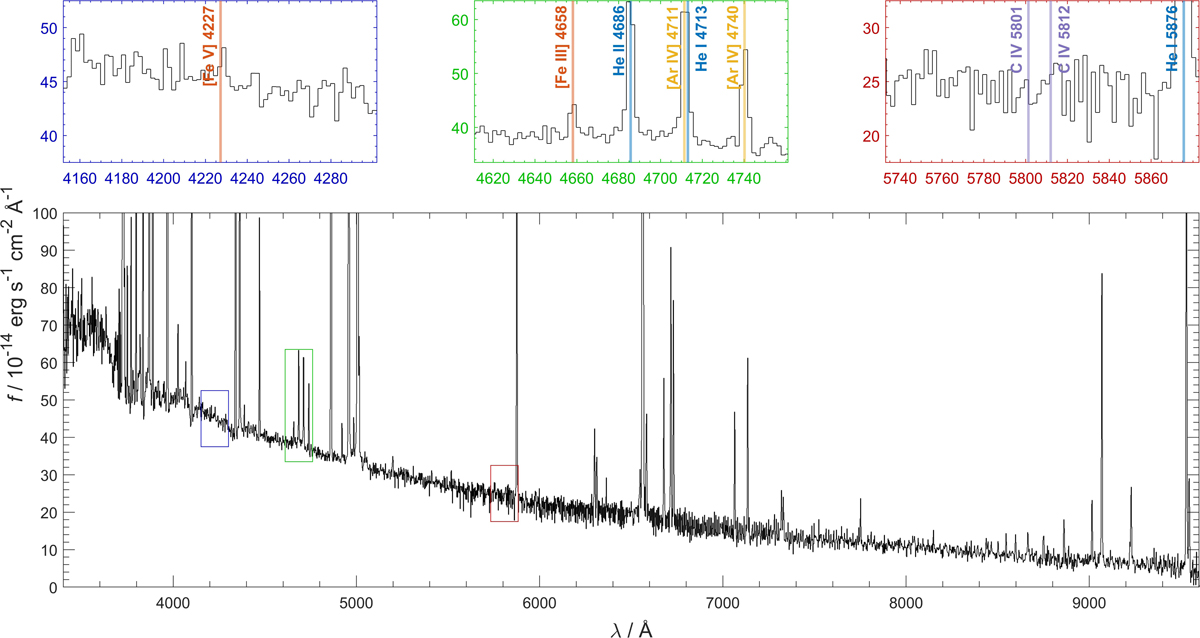
Fig. 11.
Download original image
3400 Å–9600 Å region of the stack of eighteen redshift-corrected SDSS spectra of the IMP sample, binned in 1 Å bins and truncated in flux density f to enhance the visibility of weak spectral features (bottom row). The coloured boxes indicate the regions shown in the blow-ups in the top row, centred at [FeV] 4227, He II 4686, and C IV 5808 (blue, green, and red insets, respectively). Noteworthy emission lines (both present and absent) are marked by coloured vertical lines. The SDSS wavelengths were converted to vacuum wavelengths following Morton (1991).
Current usage metrics show cumulative count of Article Views (full-text article views including HTML views, PDF and ePub downloads, according to the available data) and Abstracts Views on Vision4Press platform.
Data correspond to usage on the plateform after 2015. The current usage metrics is available 48-96 hours after online publication and is updated daily on week days.
Initial download of the metrics may take a while.