Fig. 1.
Download original image
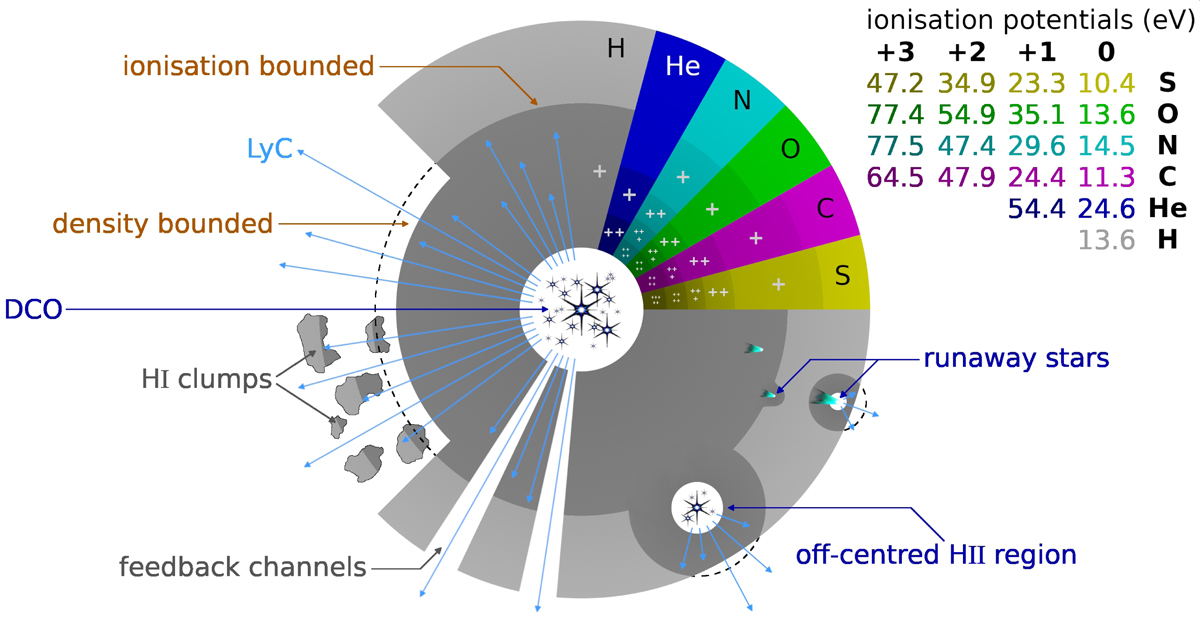
Annotated sketch highlighting several scenarios present in an H II region around a dominant central object (DCO). Light blue arrows represent LyC photons, where an arrow ending within the extent of the H II region indicates absorption, and an arrow exceeding the region’s extent represents escape. The top left quadrant depicts the extent of H I and H II for the density- and ionisation-bounded textbook scenarios, whereas the bottom left quadrant is intended to highlight the role of a more complex gas geometry on LyC escape. The bottom right quadrant serves as a reminder that the spatial distribution of ionising sources further influences the observed LyC flux. Finally, the top right quadrant illustrates that the regions occupied by different ions vary in size, mediated by their respective ionisation potentials (an overview of the ionisation energies of a few select atoms is given in the table at the top right).
Current usage metrics show cumulative count of Article Views (full-text article views including HTML views, PDF and ePub downloads, according to the available data) and Abstracts Views on Vision4Press platform.
Data correspond to usage on the plateform after 2015. The current usage metrics is available 48-96 hours after online publication and is updated daily on week days.
Initial download of the metrics may take a while.