Fig. D.3.
Download original image
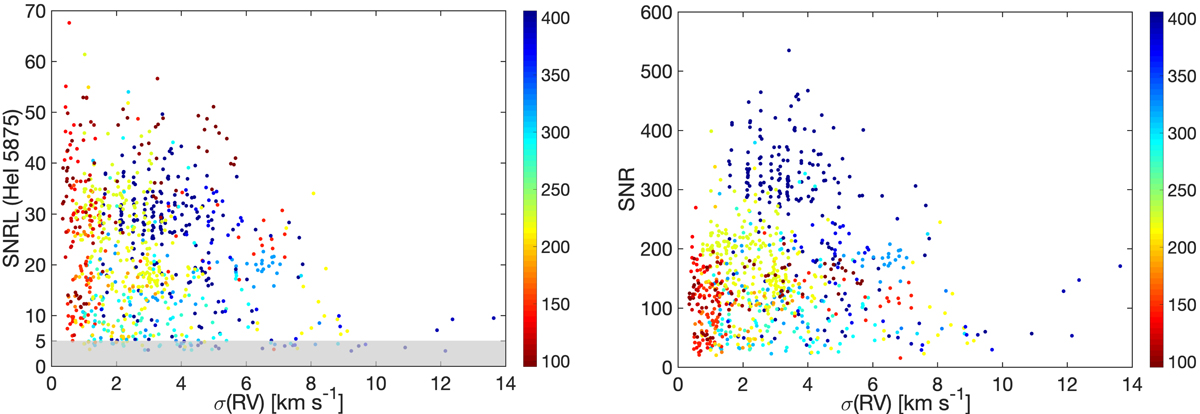
Distribution of individual radial velocity errors vs. signal-to-noise of the HeIλ5875 line (S/NL, left panel) and overall signal-to-noise of the spectrum (S/N, right panel) respect to the v sin i (the colour bars on the right) for all analyzed spectra from the working sample. The gray region represents the limit of S/NL < 5.
Current usage metrics show cumulative count of Article Views (full-text article views including HTML views, PDF and ePub downloads, according to the available data) and Abstracts Views on Vision4Press platform.
Data correspond to usage on the plateform after 2015. The current usage metrics is available 48-96 hours after online publication and is updated daily on week days.
Initial download of the metrics may take a while.