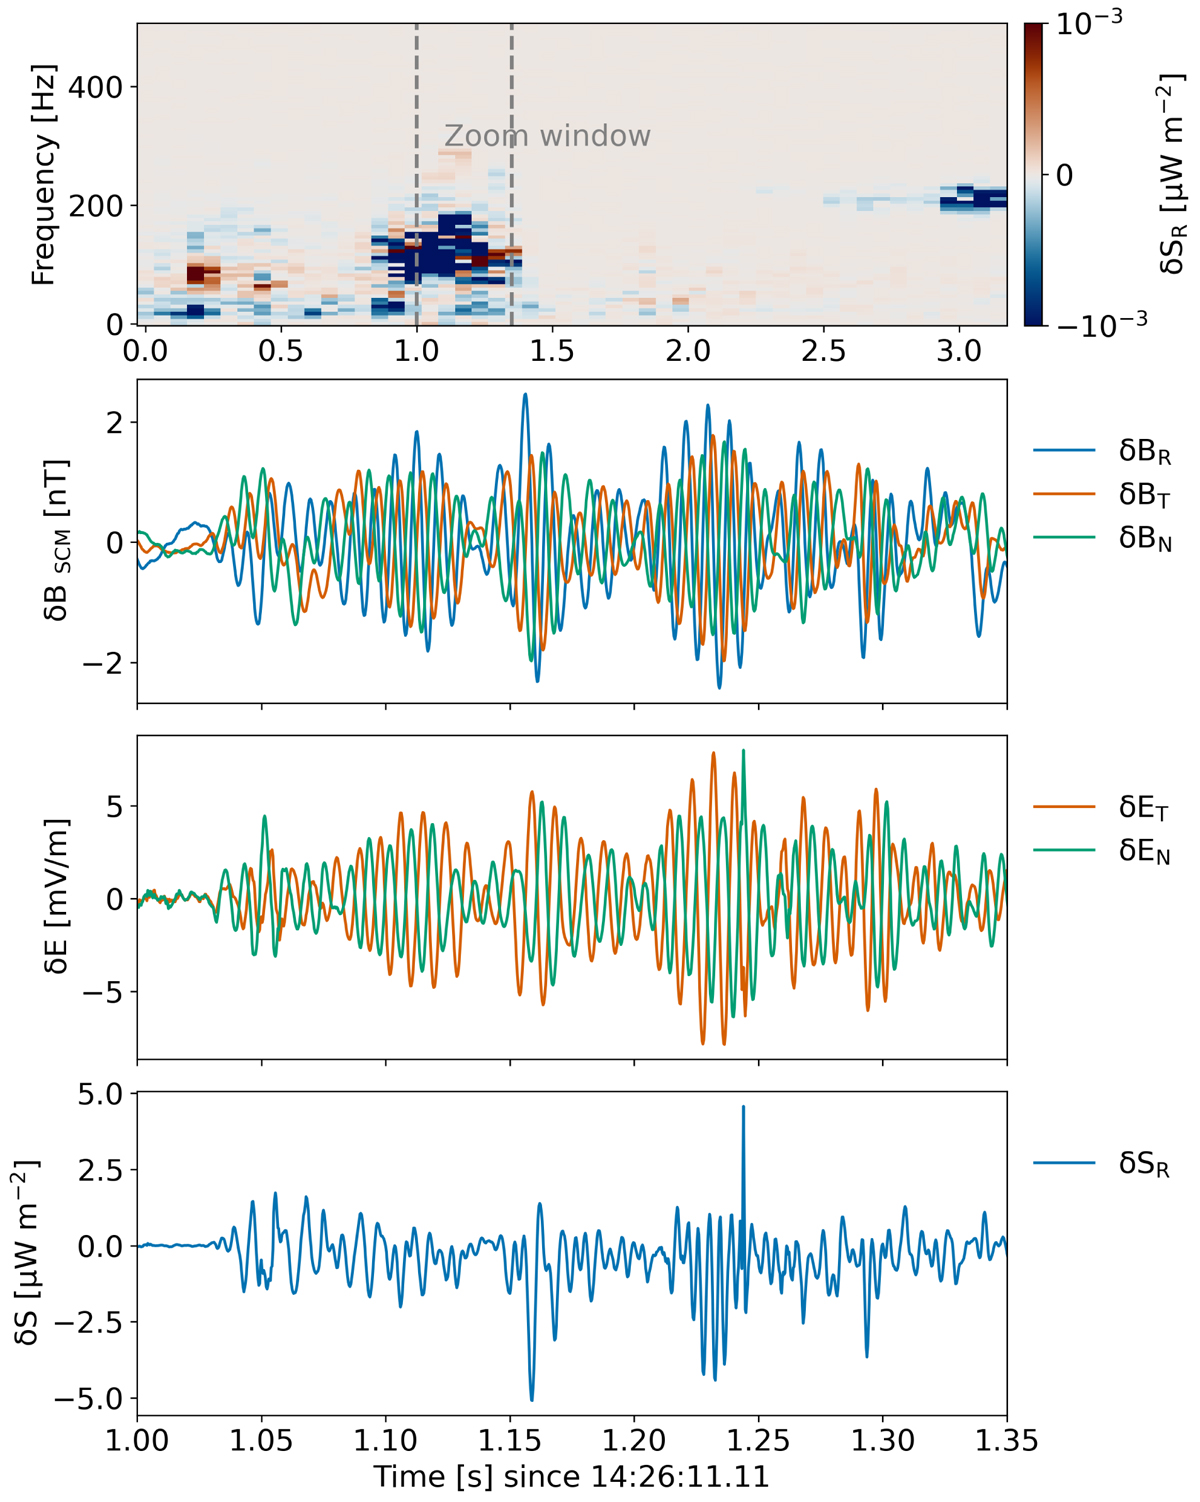
Fig. 5.
Download original image
Magnetic and electric waveforms, and Poynting flux for event 2. First panel: spectrogram of the R-component of the Poynting flux. The two gray dashed lines delimit the temporal window for the waveforms shown. Second panel: DFB magnetic burst waveforms from the SCM measurements. Third panel: DFB electric burst waveforms from the EF measurements. Fourth row: waveform of the radial component of the Poynting flux SR.
Current usage metrics show cumulative count of Article Views (full-text article views including HTML views, PDF and ePub downloads, according to the available data) and Abstracts Views on Vision4Press platform.
Data correspond to usage on the plateform after 2015. The current usage metrics is available 48-96 hours after online publication and is updated daily on week days.
Initial download of the metrics may take a while.