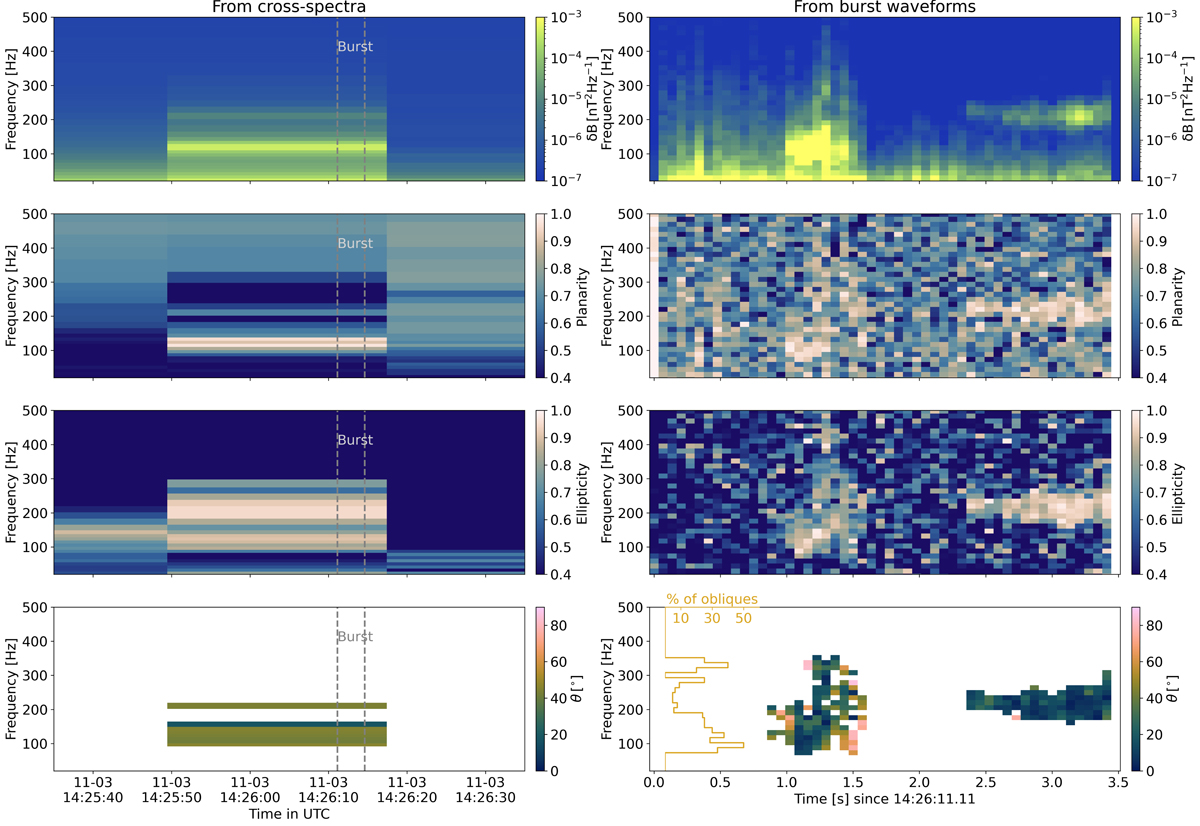
Fig. 4.
Download original image
Polarization properties derived from the magnetic field measurements using the SVD technique for event 2. The panels are the same as in Fig. 2 for event 1. However, here the time window considered in the right panels corresponds to the burst time window indicated in the left panels in between the two gray dashed lines. The percentage of oblique whistlers per frequency bin is displayed for the burst waveform analysis.
Current usage metrics show cumulative count of Article Views (full-text article views including HTML views, PDF and ePub downloads, according to the available data) and Abstracts Views on Vision4Press platform.
Data correspond to usage on the plateform after 2015. The current usage metrics is available 48-96 hours after online publication and is updated daily on week days.
Initial download of the metrics may take a while.