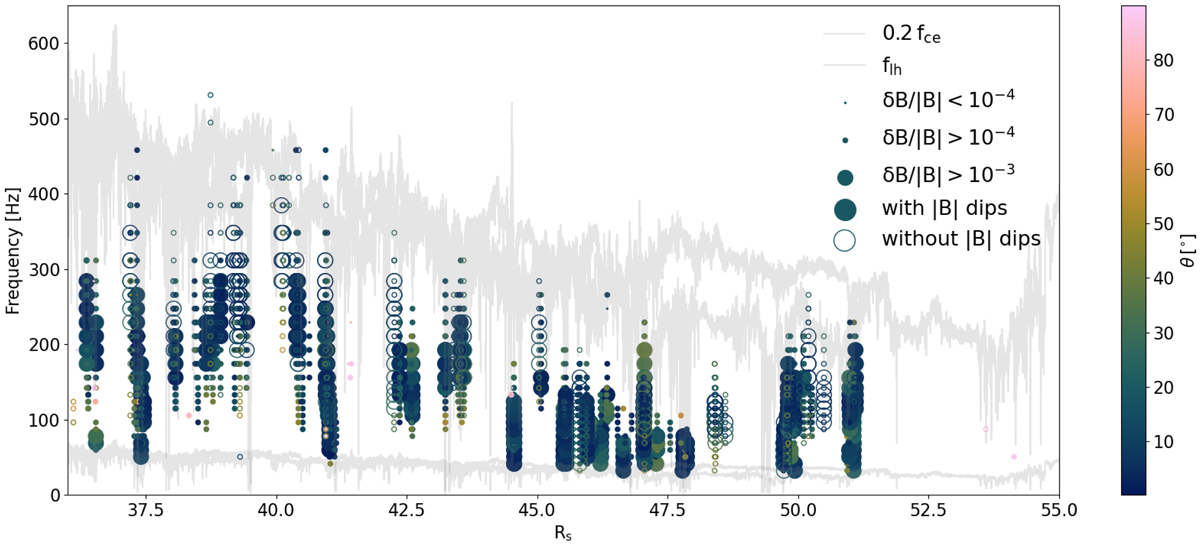
Fig. 14.
Download original image
Summary figure of the properties extracted from the whistlers detected in the DFB cross-spectra for PSP encounter 1. Wave frequency vs. solar distance. Each dot represents a wave packet in the spectra, with their WNA color-coded, their relative amplitude constraining the size of the dot, and the absence of collocation with |B| dip resulting in an empty dot. The two gray lines indicate 20% of the electron-cyclotron frequency fce and the lower-hybrid frequency flh, from November 1, 2018, until November 11, 2018. As seen in Sect. 4.1, most of the whistlers are detected from November 1 to November 5. The second part of these gray lines (the outbound phase of the encounter) are thus relevant for very few events.
Current usage metrics show cumulative count of Article Views (full-text article views including HTML views, PDF and ePub downloads, according to the available data) and Abstracts Views on Vision4Press platform.
Data correspond to usage on the plateform after 2015. The current usage metrics is available 48-96 hours after online publication and is updated daily on week days.
Initial download of the metrics may take a while.