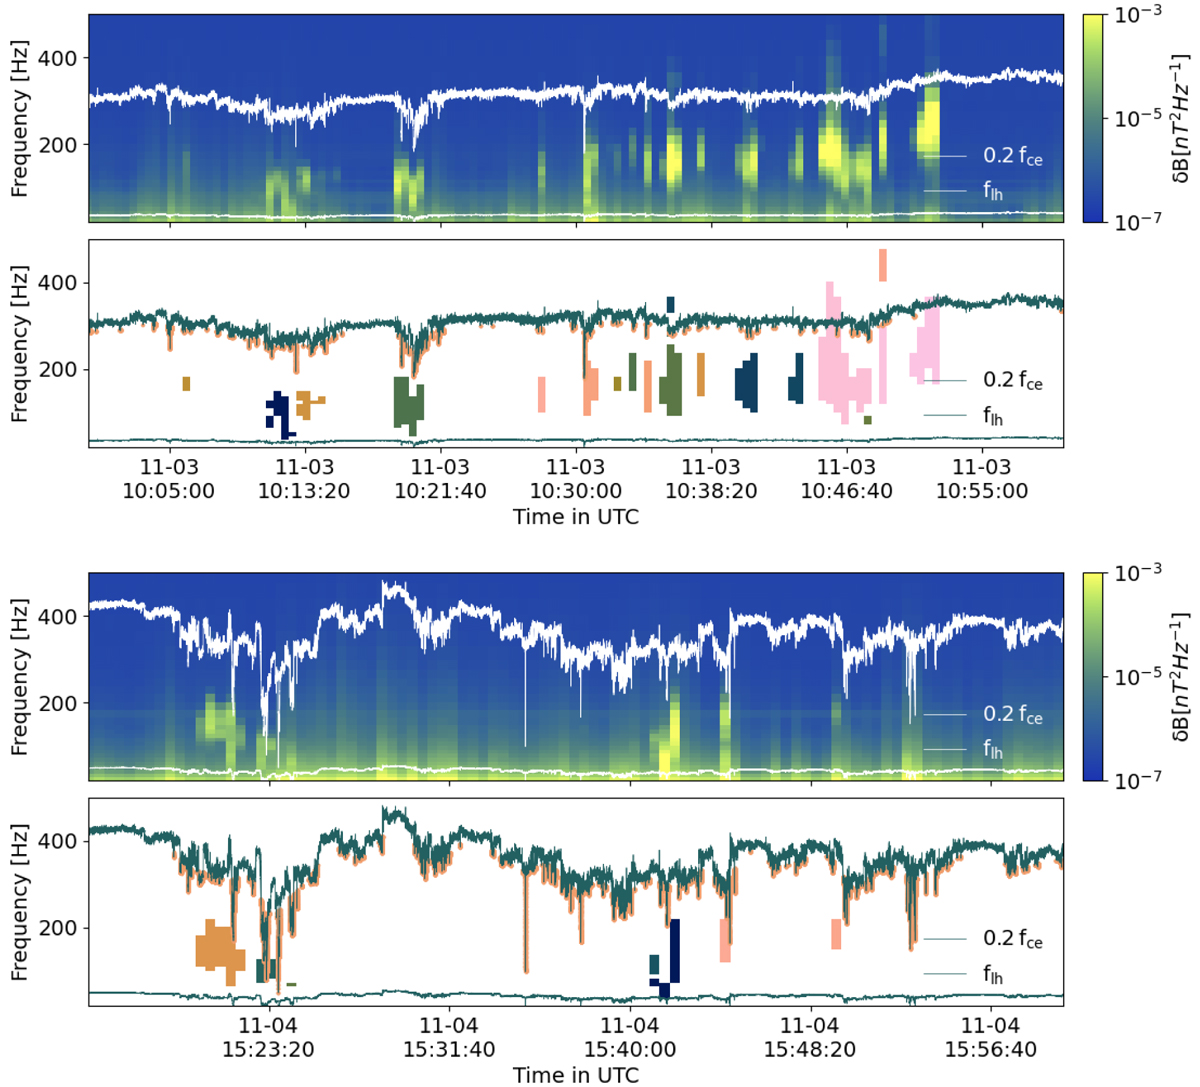
Fig. 12.
Download original image
Two intervals of whistlers detected in the cross-spectra collocated with magnetic dips (each lasting about one hour). For both panels, the first row shows the trace of the spectral matrices. The two white lines indicate 20% of the electron-cyclotron frequency fce and the lower hybrid frequency flh. The second row shows the whistler clusters detected; the assigned colors are random. The two green lines indicate 20% of the electron-cyclotron frequency fce and the lower hybrid frequency flh. The magnetic dips, detected with the method described in Sect. 2.4, are highlighted in pink.
Current usage metrics show cumulative count of Article Views (full-text article views including HTML views, PDF and ePub downloads, according to the available data) and Abstracts Views on Vision4Press platform.
Data correspond to usage on the plateform after 2015. The current usage metrics is available 48-96 hours after online publication and is updated daily on week days.
Initial download of the metrics may take a while.