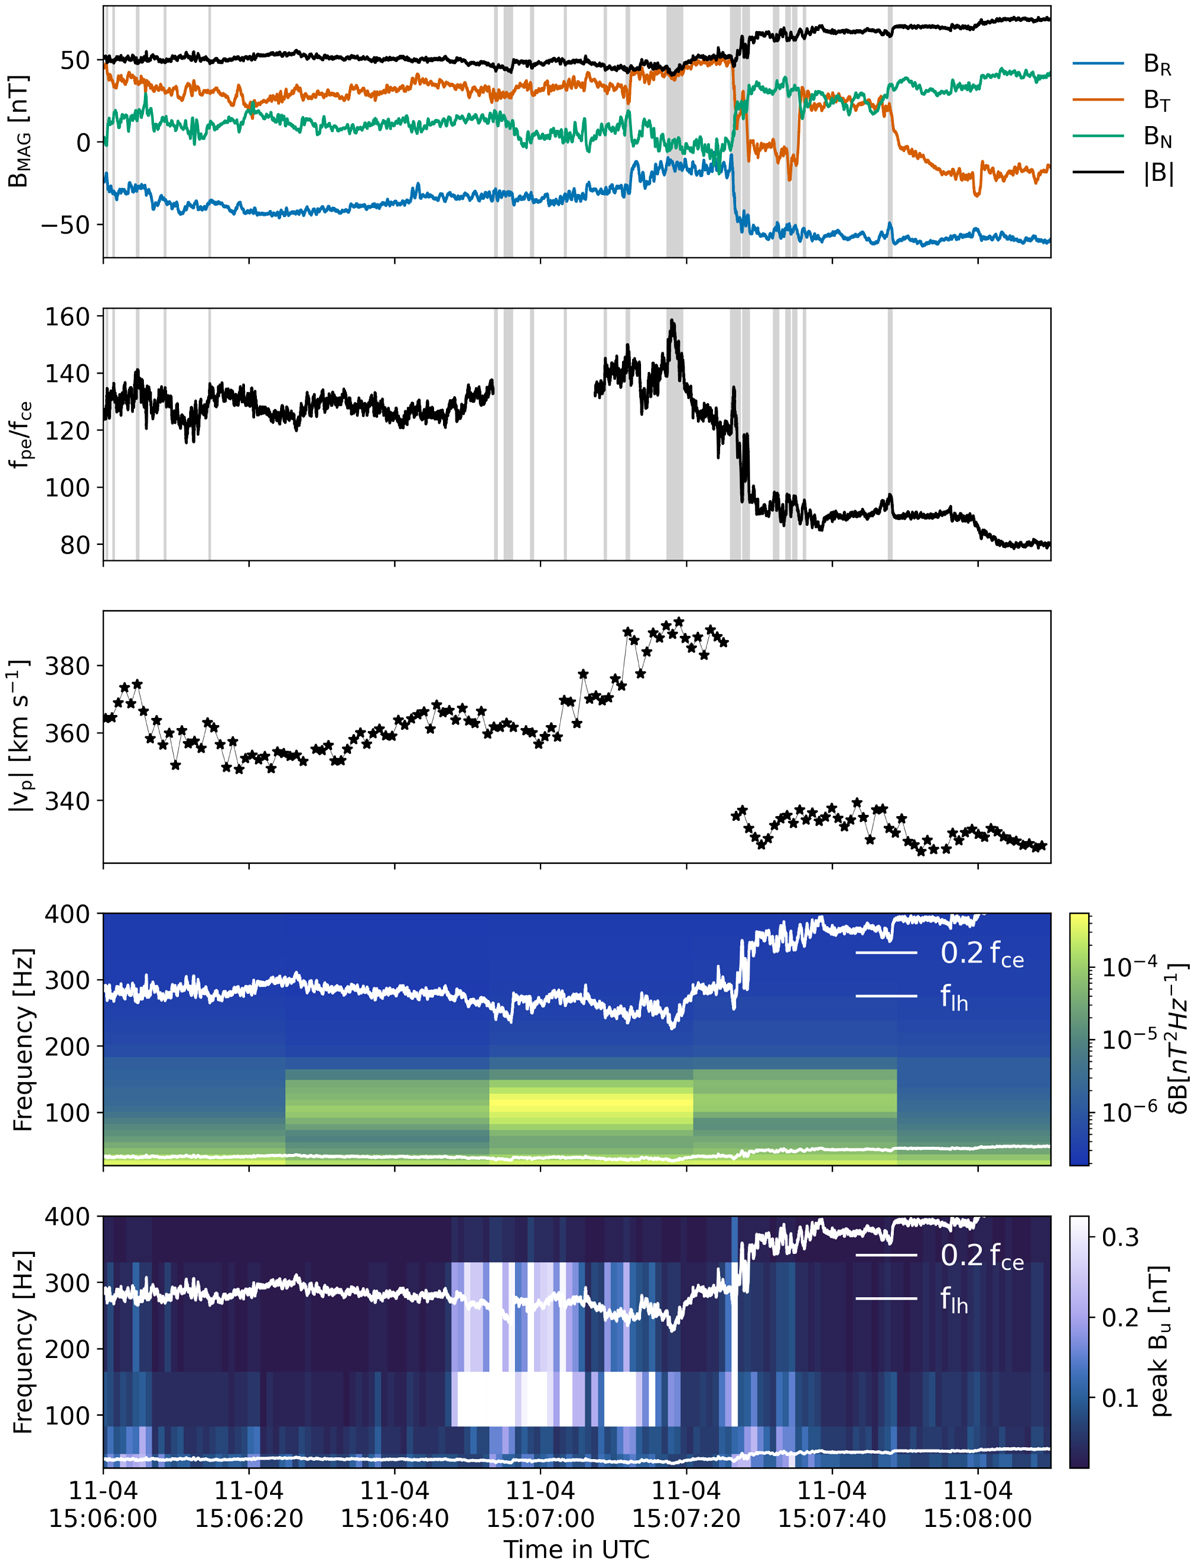
Fig. 1.
Download original image
Event 1: Whistler waves observed on November 4, 2018, around 15:07 UTC. First panel: solar wind background magnetic field components in the RTN frame and magnitude from the MAG instrument. Second panel: fpe/fce ratio. In these two first panels the gray bars highlight the presence of dips in the background magnetic field (see Sect. 2.4). Third panel: magnitude of the proton velocity from the SWEAP/SPC instrument. Fourth panel: trace of the cross-spectral matrix. Fifth panel: peak value of the corresponding band-pass filtered measurements for the unique direction available for this data product. In the last two panels the two white lines indicate 0.2fce (local electron-cyclotron frequency) and the lower-hybrid frequency flh.
Current usage metrics show cumulative count of Article Views (full-text article views including HTML views, PDF and ePub downloads, according to the available data) and Abstracts Views on Vision4Press platform.
Data correspond to usage on the plateform after 2015. The current usage metrics is available 48-96 hours after online publication and is updated daily on week days.
Initial download of the metrics may take a while.