Fig. 8
Download original image
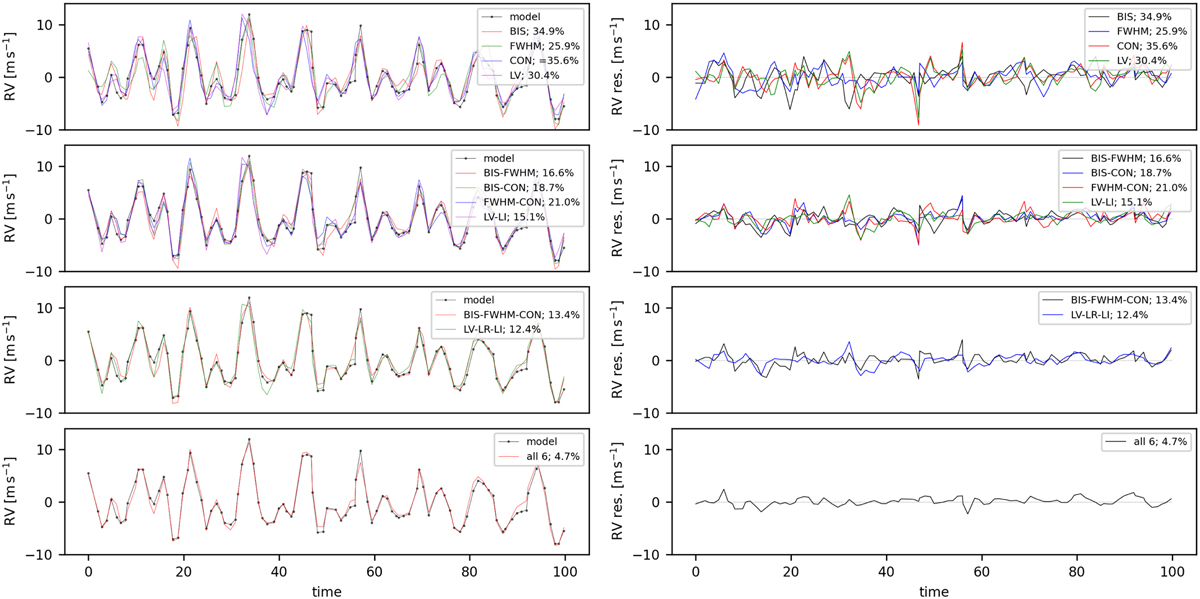
Illustration of the quality of the RV correction as a function of the input indices used (random synthetic set chosen) for the ε Eri data and the uniform time sampling (black lines). The output predictions of the NNs with all the combinations of input data, i.e. index time series, are illustrated with different colours. The outcome of using only one index is shown in the top panel, further down two indices, then combinations of three indices (photometry and CCF), and then time-series data from all six indices. Radial velocities are shown as modelled by starsim. The legends contain the RV RRE of this particular set for each combination of index inputs. The residuals (differences between RV predictions and the simulated RV) are shown in the right panels.
Current usage metrics show cumulative count of Article Views (full-text article views including HTML views, PDF and ePub downloads, according to the available data) and Abstracts Views on Vision4Press platform.
Data correspond to usage on the plateform after 2015. The current usage metrics is available 48-96 hours after online publication and is updated daily on week days.
Initial download of the metrics may take a while.