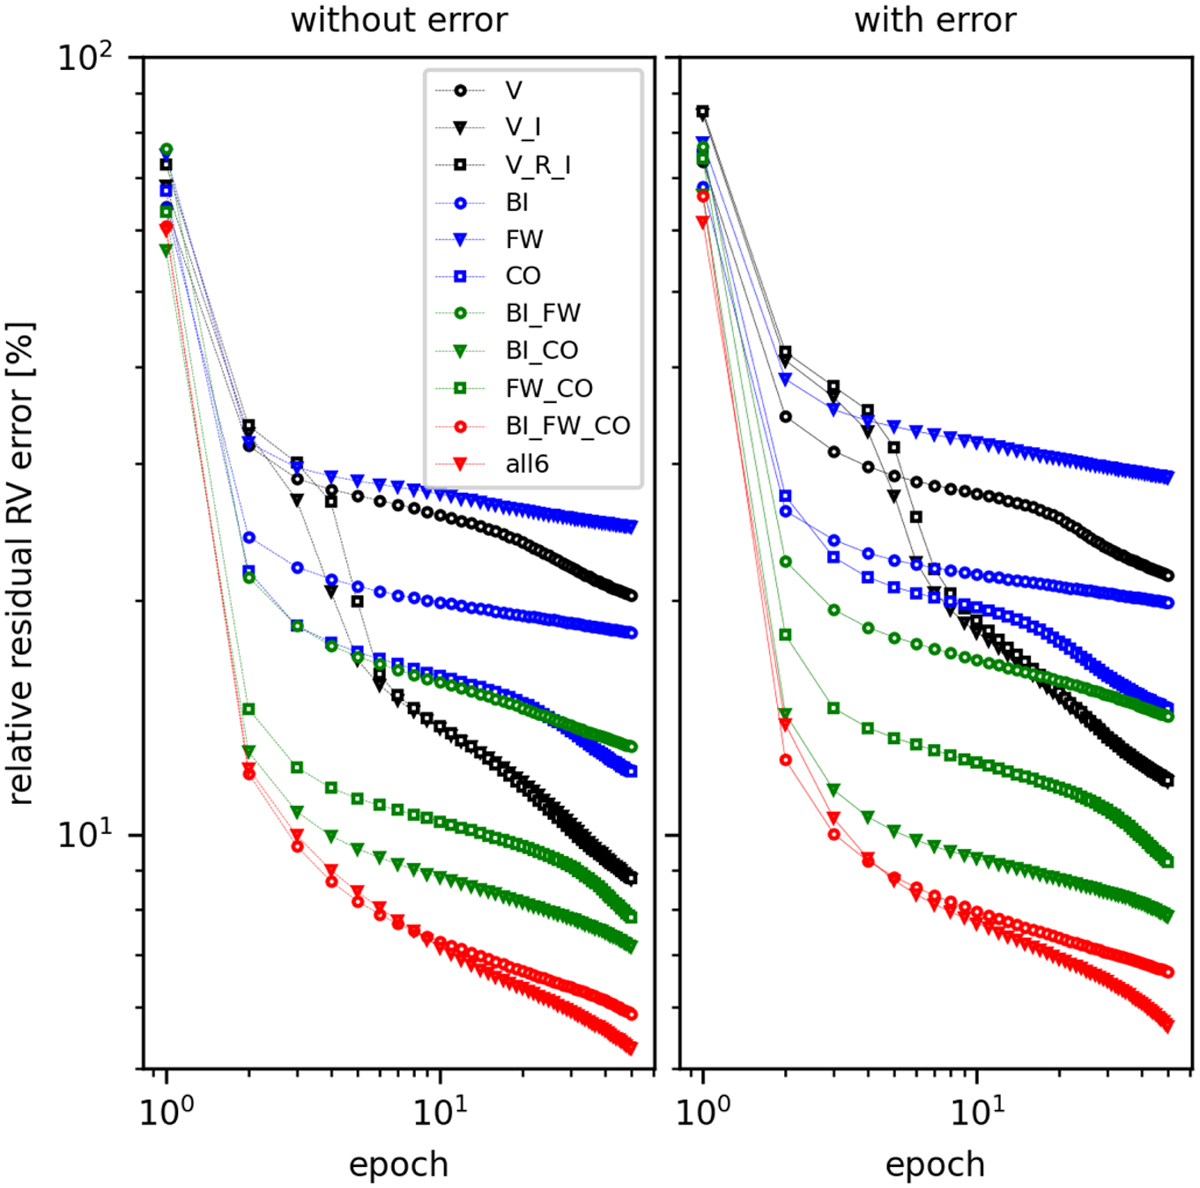
Fig. 6
Download original image
Evolution of the RRE of the 60 000 synthetic ε Eri test set RVs for the 50 epochs for the NNs using all different combinations of input data, i.e. activity index time series as indicated, the uniform time sampling, and no additional error on the training input sets. The curves are shown for the test sets without additional uncertainties as calculated by starsim (left panel, dashed lines) and for the case where we included the error value from Table 2 for each activity index into the test sets (right panel, full drawn lines).
Current usage metrics show cumulative count of Article Views (full-text article views including HTML views, PDF and ePub downloads, according to the available data) and Abstracts Views on Vision4Press platform.
Data correspond to usage on the plateform after 2015. The current usage metrics is available 48-96 hours after online publication and is updated daily on week days.
Initial download of the metrics may take a while.