Fig. 16.
Download original image
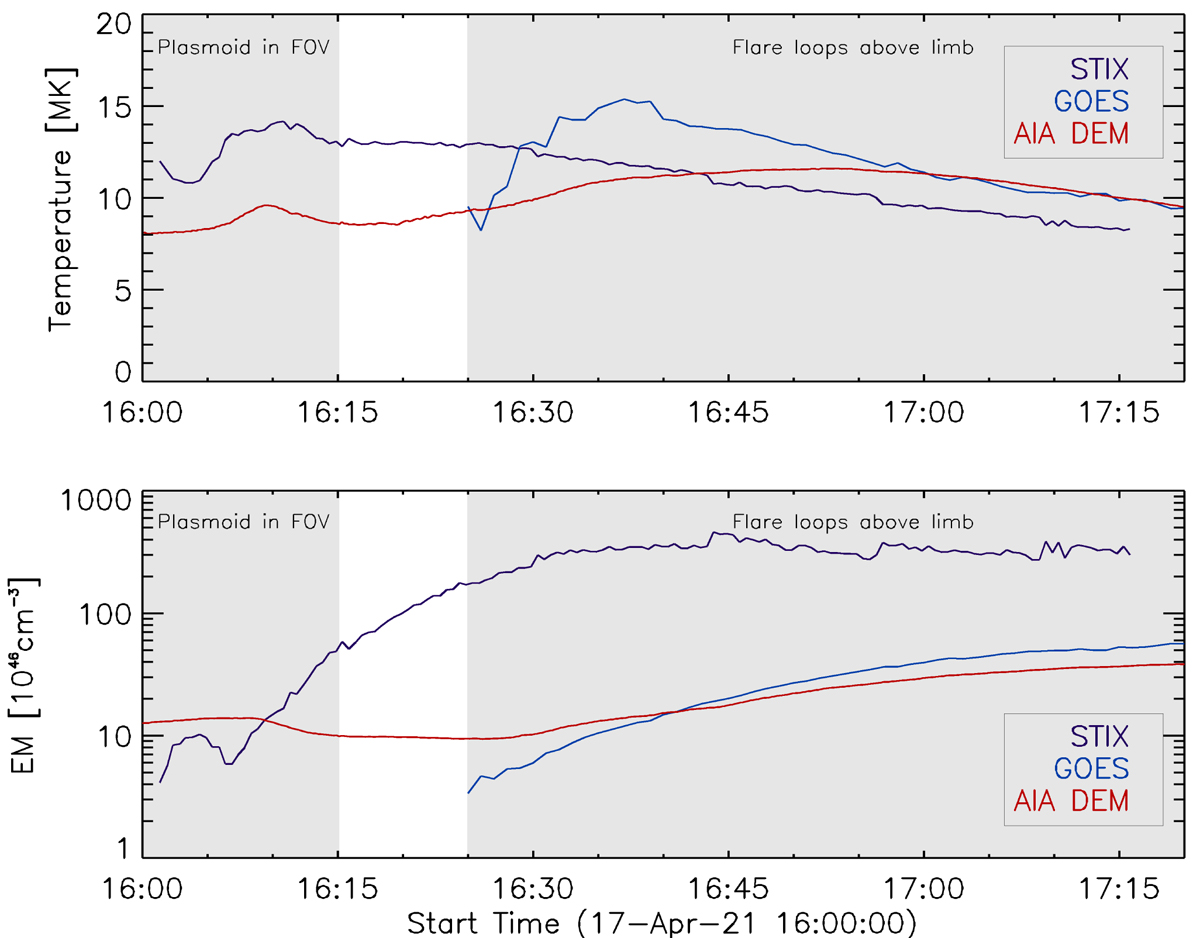
Evolution of thermal plasma parameters. Top panel: plasma temperatures over the entire flare region derived from different instruments. Bottom panel: total EM for the same region. The first shaded region indicates the time span when the erupting plasmoid was detected with AIA. After the plasmoid left the FOV, most of the GOES and AIA emission was occulted behind the east limb. The second shaded region indicates when higher flare loops appeared above the limb, as seen from Earth, and the GOES signal was again strong enough to derive reliable results.
Current usage metrics show cumulative count of Article Views (full-text article views including HTML views, PDF and ePub downloads, according to the available data) and Abstracts Views on Vision4Press platform.
Data correspond to usage on the plateform after 2015. The current usage metrics is available 48-96 hours after online publication and is updated daily on week days.
Initial download of the metrics may take a while.