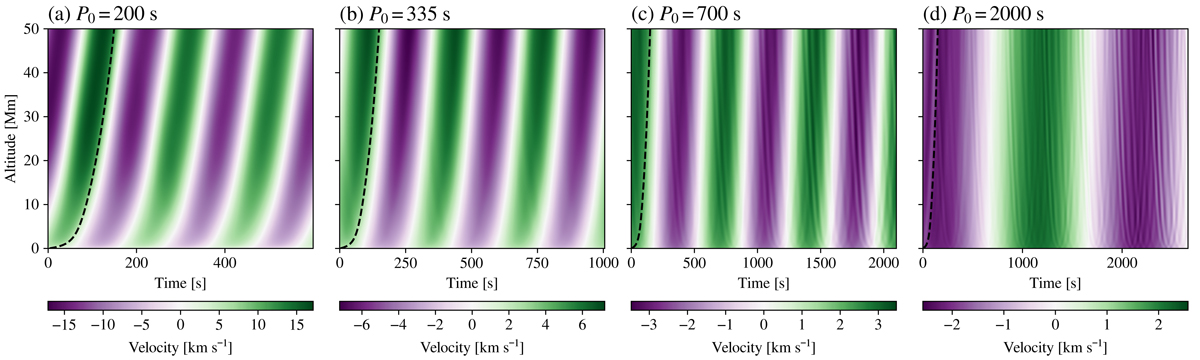
Fig. 4.
Download original image
Kink wave transverse velocity (vx) at the loop centre (x = y = 0) as a function of altitude and time. The velocity is shown for four 3D simulations with different driver periods P0, after an initial settling time of 2P0 (for P0 = 200 s, 335 s, and 700 s), or 0.42P0 (for P0 = 2000 s). The dashed black lines represent a propagation at the kink speed (see Eq. (13)), and are independent of the driver period.
Current usage metrics show cumulative count of Article Views (full-text article views including HTML views, PDF and ePub downloads, according to the available data) and Abstracts Views on Vision4Press platform.
Data correspond to usage on the plateform after 2015. The current usage metrics is available 48-96 hours after online publication and is updated daily on week days.
Initial download of the metrics may take a while.