Fig. 5
Download original image
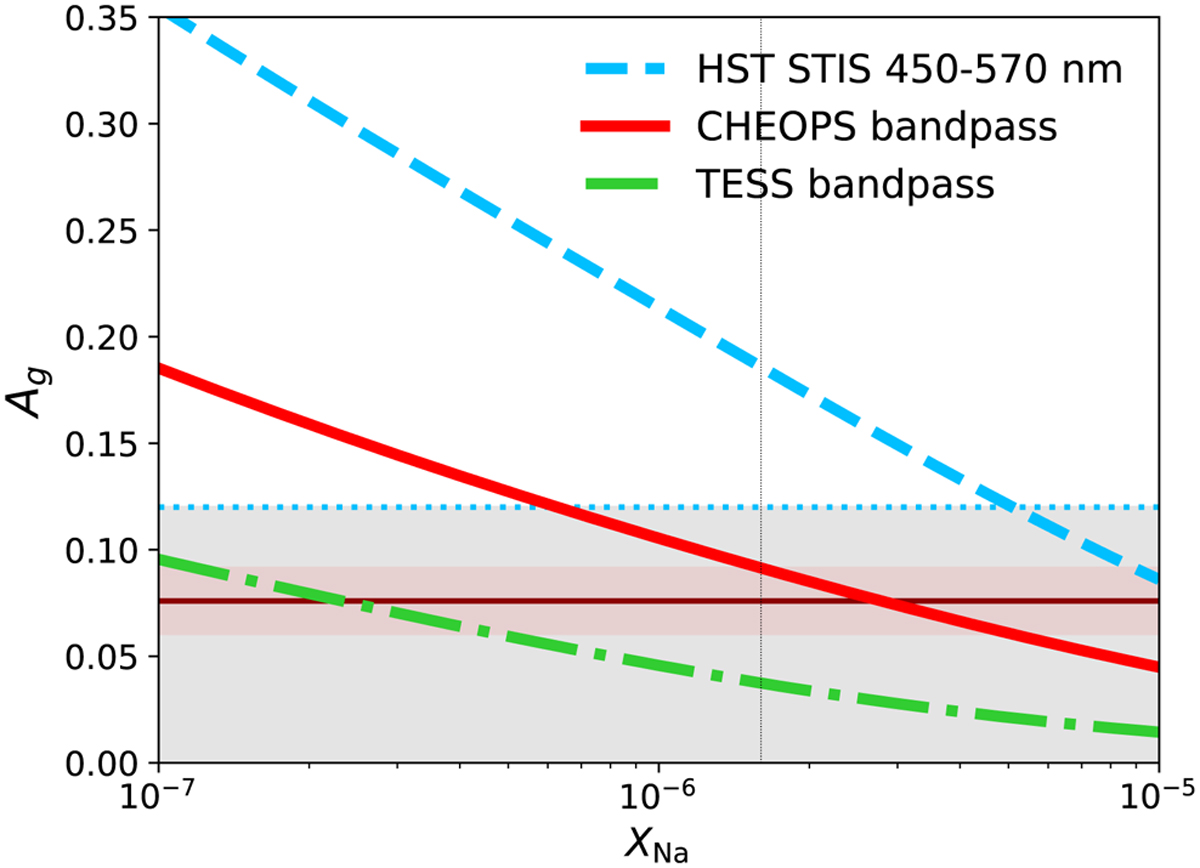
Comparison of measured and theoretical geometric albedos of HD 189733 b. The blue dotted line denotes the upper limit for the geometric albedo Ag = 0.12 as measured by Evans et al. (2013) in the HST STIS bandpass. The red shaded region denotes our CHEOPS albedo measurement (±lσ). The blue dashed, red, and green curves respectively denote for HST STIS, CHEOPS, and TES S the theoretically calculated albedos Ag integrated over the respective bandpasses for different XNa abundances. HST STIS and CHEOPS measurements are consistent with each other if XNa ≥ 6 × 10¯6. The corresponding TES S albedo would be very low, and thus undetectable according to the model used here.
Current usage metrics show cumulative count of Article Views (full-text article views including HTML views, PDF and ePub downloads, according to the available data) and Abstracts Views on Vision4Press platform.
Data correspond to usage on the plateform after 2015. The current usage metrics is available 48-96 hours after online publication and is updated daily on week days.
Initial download of the metrics may take a while.