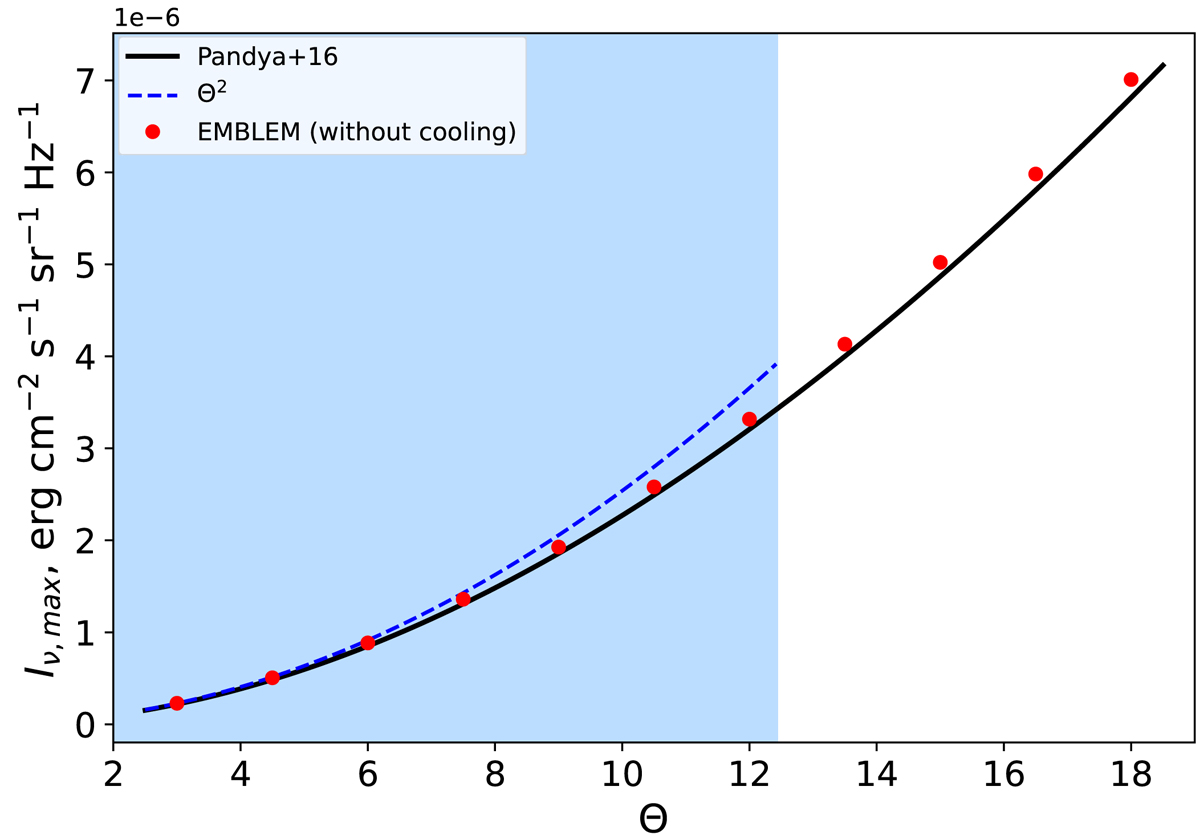
Fig. C.1.
Download original image
Specific intensity at the end of the growth phase (t = tgrowth = 75 rg/c) of a κ distribution with ne = 5 × 106 cm−3, B = 10 G, and κ = 4 for a range of Θe computed from the full fitting formulae of Pandya et al. (2016) (black curve) with the EMBLEM code (red dots) and with the high-frequency limit analytical expression (dashed blue curve). We overplot in light blue the range of Θe in which Xκ > 2000, i.e., where the relative error between the high-frequency limit and the full formula is lower than 20%.
Current usage metrics show cumulative count of Article Views (full-text article views including HTML views, PDF and ePub downloads, according to the available data) and Abstracts Views on Vision4Press platform.
Data correspond to usage on the plateform after 2015. The current usage metrics is available 48-96 hours after online publication and is updated daily on week days.
Initial download of the metrics may take a while.