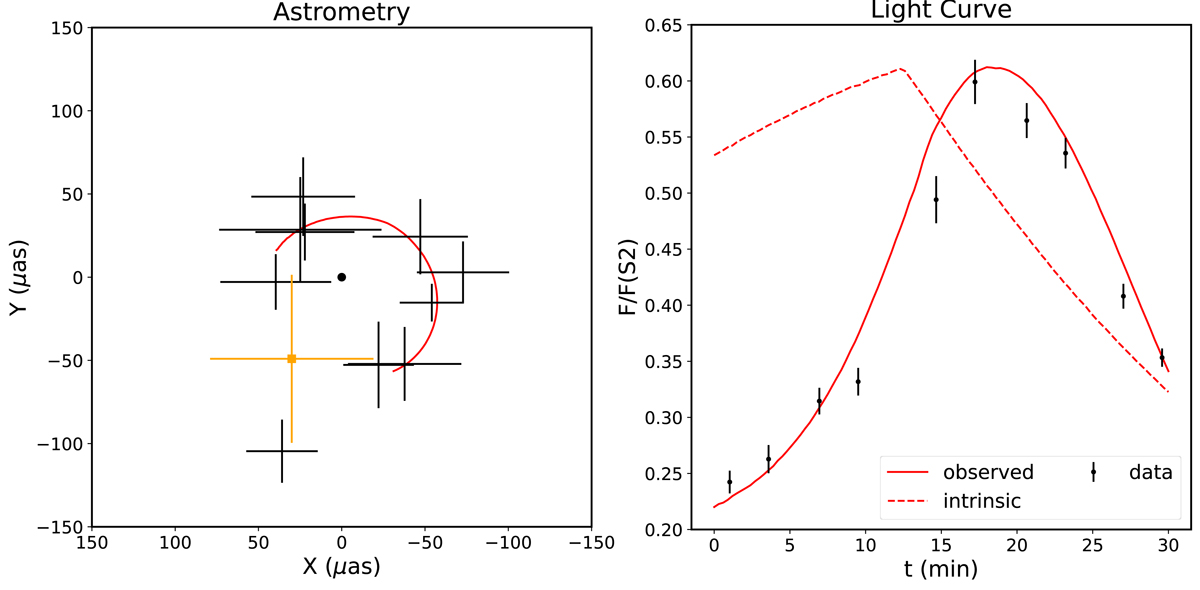
Fig. 8.
Download original image
Data and plasmoid models of the flares from July 22, 2018. The left panels shows the astrometry of the flare while the right panel shows the observed (full line) and intrinsic (dashed line) light curves. The parameters of the model are listed in Tables 3 and 4. Note that this is not the result of a fit. The black dot in the left panels represents the position of Sgr A* in GYOTO and the orange cross represent the position of Sgr A* measured through the orbit of S2.
Current usage metrics show cumulative count of Article Views (full-text article views including HTML views, PDF and ePub downloads, according to the available data) and Abstracts Views on Vision4Press platform.
Data correspond to usage on the plateform after 2015. The current usage metrics is available 48-96 hours after online publication and is updated daily on week days.
Initial download of the metrics may take a while.