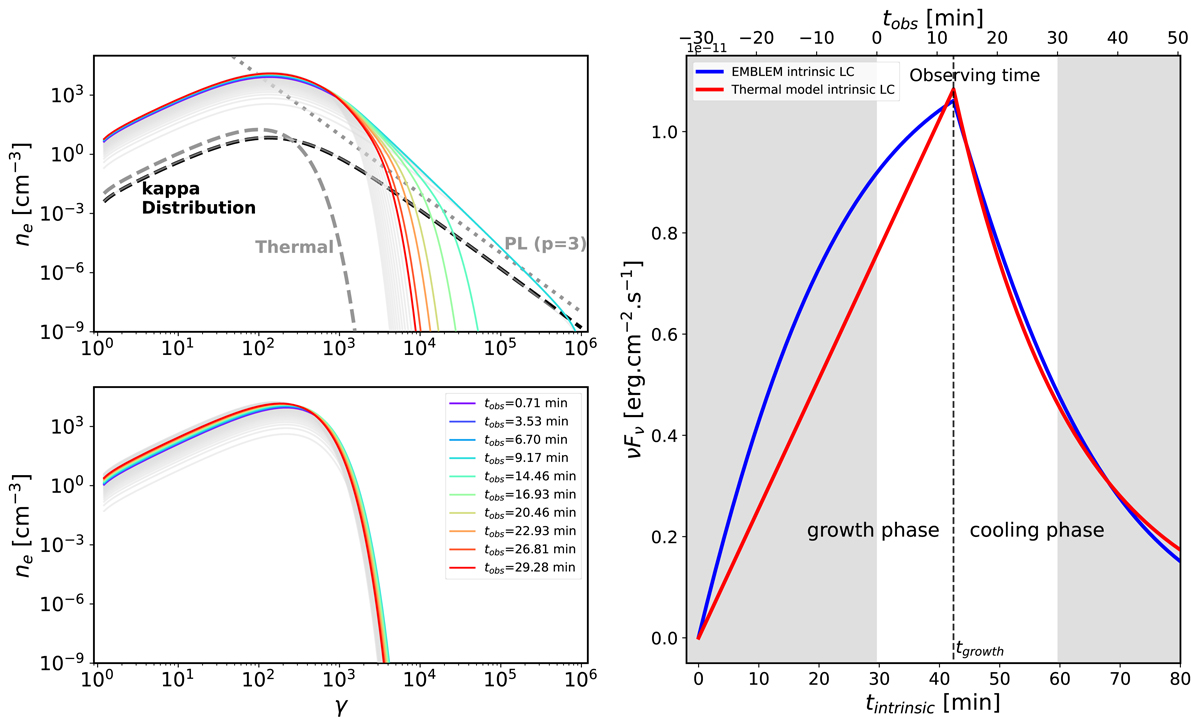
Fig. 6.
Download original image
Top left: evolution of the electron distribution in our model with EMBLEM at each observing time of the flare on 22 July 2018. The dotted black line corresponds to the injected κ electron distribution, which is composed of a thermal core with a power-law tail. The parameters are listed in Table 3. Bottom left: evolution of the electron distribution in the thermal model inspired by Ball et al. (2021) at each observing time of the flare on 22 July 2018. The parameters used for this distribution are the same as in our model (listed in Table 3), but with a dimensionless temperature of Θe = 109 and a magnetic field of B = 20 G. Right: full intrinsic light curves of the two models. We plot the light curve from the beginning of the growth phase in this panel, and in the left panels, we plot the distribution at the observed time of Fig. 8 (tobs = tintrinsic − 29.6 min).
Current usage metrics show cumulative count of Article Views (full-text article views including HTML views, PDF and ePub downloads, according to the available data) and Abstracts Views on Vision4Press platform.
Data correspond to usage on the plateform after 2015. The current usage metrics is available 48-96 hours after online publication and is updated daily on week days.
Initial download of the metrics may take a while.