Fig. 4.
Download original image
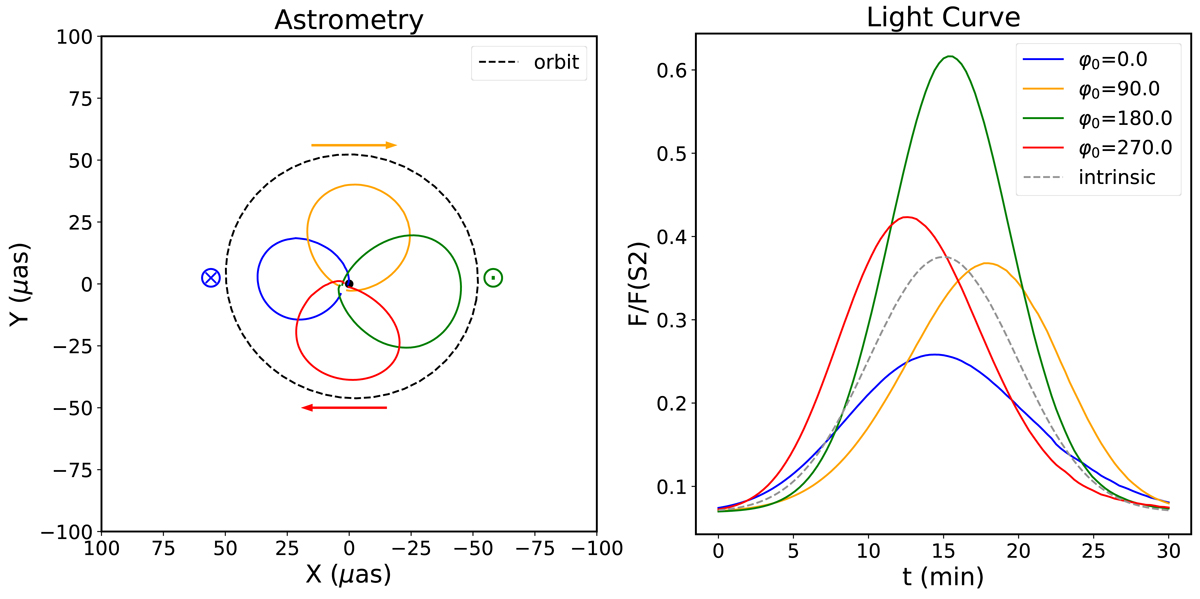
Astrometry (left) and light curves (right) of the hot spot – jet model for four initial azimuthal angles φ0 of 0deg in blue, 90deg in orange, 180deg in green, and 270deg in red. The dashed black line shows the primary image centroid track without a quiescent jet (clockwise). The jet dominates the beginning and end of the flares. The observed centroids thus start and end close to the jet centroid. The apparent orbits rotate around the latter with φ0 as the maximum of emission occurs at different φ. The Gaussian modulation, which has a typical duration of tσ = 15 min (dashed gray line; this is the same for the four the curves) is affected by relativistic effects. For negative X (right part of the astrometry), the beaming, combined with relativistic Doppler effect, amplifies the flux from the hot spot, and in the positive X (left part of the figure), the beaming decreases the flow. The black dot in the left panels represents the position of Sgr A*.
Current usage metrics show cumulative count of Article Views (full-text article views including HTML views, PDF and ePub downloads, according to the available data) and Abstracts Views on Vision4Press platform.
Data correspond to usage on the plateform after 2015. The current usage metrics is available 48-96 hours after online publication and is updated daily on week days.
Initial download of the metrics may take a while.