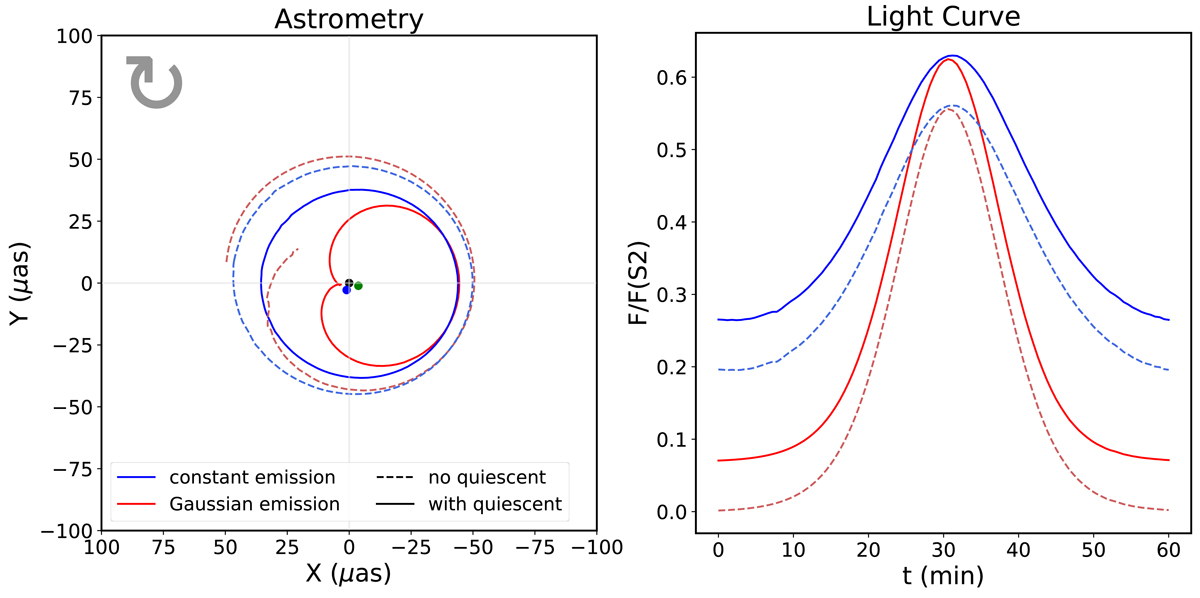
Fig. 3.
Download original image
Astrometry (left) and light curves (right) of the hot spot – jet model with two values for the quiescent state corresponding to no quiescent (dashed lines) and the with quiescent state (full lines). In shades of blue, the hot spot has a nearly constant emission (tσ ≫ torbit). The effect of beaming is reflected in the light curves. In shades of red, the hot spot has a Gaussian time emission with tσ = 30 min. The parameters of the hot spot are listed in Table 2. We synchronized the beaming and intrinsic maximum of the Gaussian modulation. The black, blue, and green dots in the left panels represent the position of Sgr A*, the jet centroid, and the disk centroid, respectively.
Current usage metrics show cumulative count of Article Views (full-text article views including HTML views, PDF and ePub downloads, according to the available data) and Abstracts Views on Vision4Press platform.
Data correspond to usage on the plateform after 2015. The current usage metrics is available 48-96 hours after online publication and is updated daily on week days.
Initial download of the metrics may take a while.