Fig. 2.
Download original image
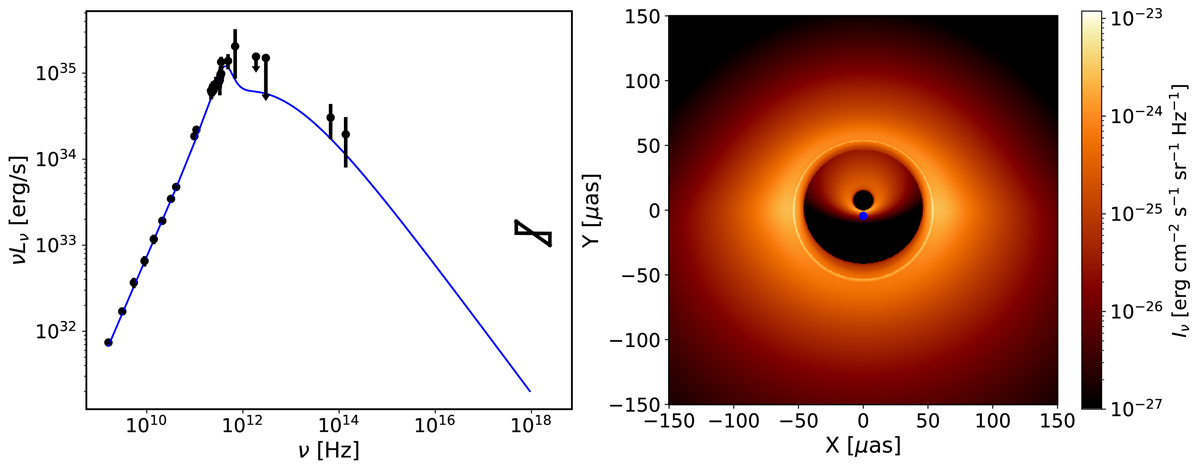
Our torus-jet model for the quiescent state of Sgr A*. Left: spectrum associated with the best fit of the torus-jet model (see Table 1) for the quiescent state of Sgr A* (![]() with nd.o.f. = 27). The data are taken from Bower et al. (2015) for ν < 50 GHz, Brinkerink et al. (2015) for the two points around 100 GHz, Liu et al. (2016) for the 492 GHz point, Marrone et al. (2006) for the 690 GHz point, von Fellenberg et al. (2018) for the far-infrared upper limits, Witzel et al. (2018) for the mid-infrared data, and Baganoff et al. (2001) for the X-ray bow-tie. We note that as in Vincent et al. (2019), the X-ray data were not fit as we did not take bremsstrahlung or Comptonized emission into account. Right: best-fit image at 2.2 μm of the torus-jet model with a field of view of 150 μas seen with an inclination of 20deg and a PALN of π rad. The color bar gives the values of the specific intensity in cgs units in log-scale. The outer region emission comes from the backward jet, and the emission close to the center comes from the forward part of the jet. The centroid of the jet is represented by the blue dot at ∼(0, −2.2).
with nd.o.f. = 27). The data are taken from Bower et al. (2015) for ν < 50 GHz, Brinkerink et al. (2015) for the two points around 100 GHz, Liu et al. (2016) for the 492 GHz point, Marrone et al. (2006) for the 690 GHz point, von Fellenberg et al. (2018) for the far-infrared upper limits, Witzel et al. (2018) for the mid-infrared data, and Baganoff et al. (2001) for the X-ray bow-tie. We note that as in Vincent et al. (2019), the X-ray data were not fit as we did not take bremsstrahlung or Comptonized emission into account. Right: best-fit image at 2.2 μm of the torus-jet model with a field of view of 150 μas seen with an inclination of 20deg and a PALN of π rad. The color bar gives the values of the specific intensity in cgs units in log-scale. The outer region emission comes from the backward jet, and the emission close to the center comes from the forward part of the jet. The centroid of the jet is represented by the blue dot at ∼(0, −2.2).
Current usage metrics show cumulative count of Article Views (full-text article views including HTML views, PDF and ePub downloads, according to the available data) and Abstracts Views on Vision4Press platform.
Data correspond to usage on the plateform after 2015. The current usage metrics is available 48-96 hours after online publication and is updated daily on week days.
Initial download of the metrics may take a while.