Fig. F.1.
Download original image
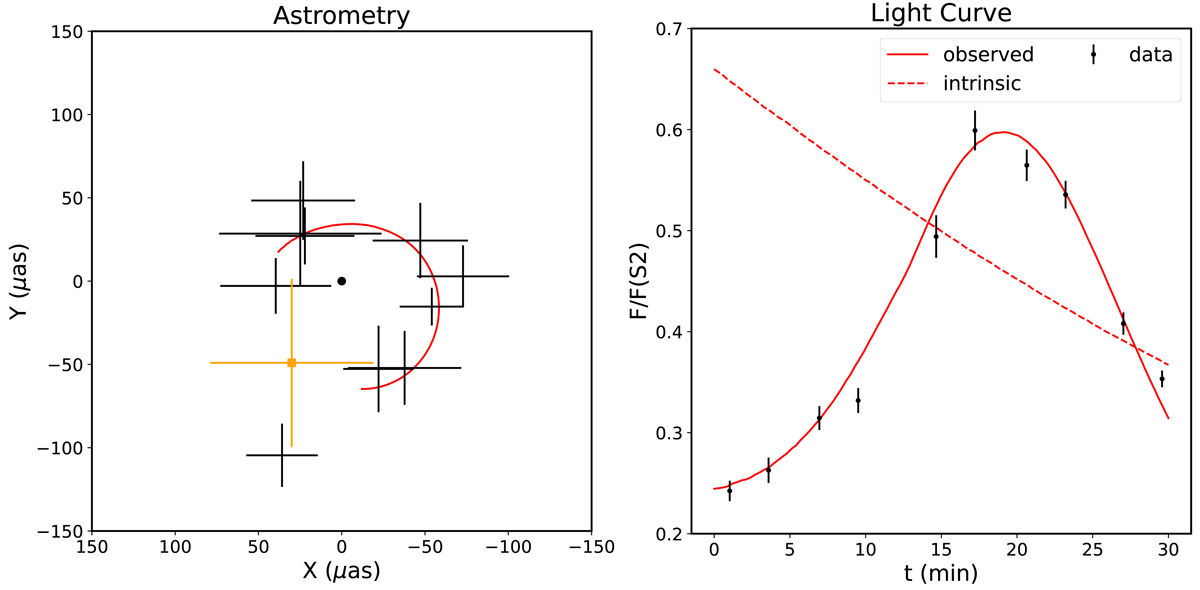
Data and plasmoid models of the flares on 22 July 2018. The left panels shows the astrometry of the flare, and the right panel shows the light curves. We used the same setup as in Fig. 8, but with a shorter growth time tgrowth = 50rg/c, Θe = 72 and B = 10 G (Table F.1), resulting in a two-peak light curve, with the first peak occurring at t = −22 min (out of the observational window), but mitigated by the negative beaming effect. The secondary peak, which matched the observed flare data shown here, is due to the positive beaming during the cooling phase (as shown by the intrinsic light curve).
Current usage metrics show cumulative count of Article Views (full-text article views including HTML views, PDF and ePub downloads, according to the available data) and Abstracts Views on Vision4Press platform.
Data correspond to usage on the plateform after 2015. The current usage metrics is available 48-96 hours after online publication and is updated daily on week days.
Initial download of the metrics may take a while.