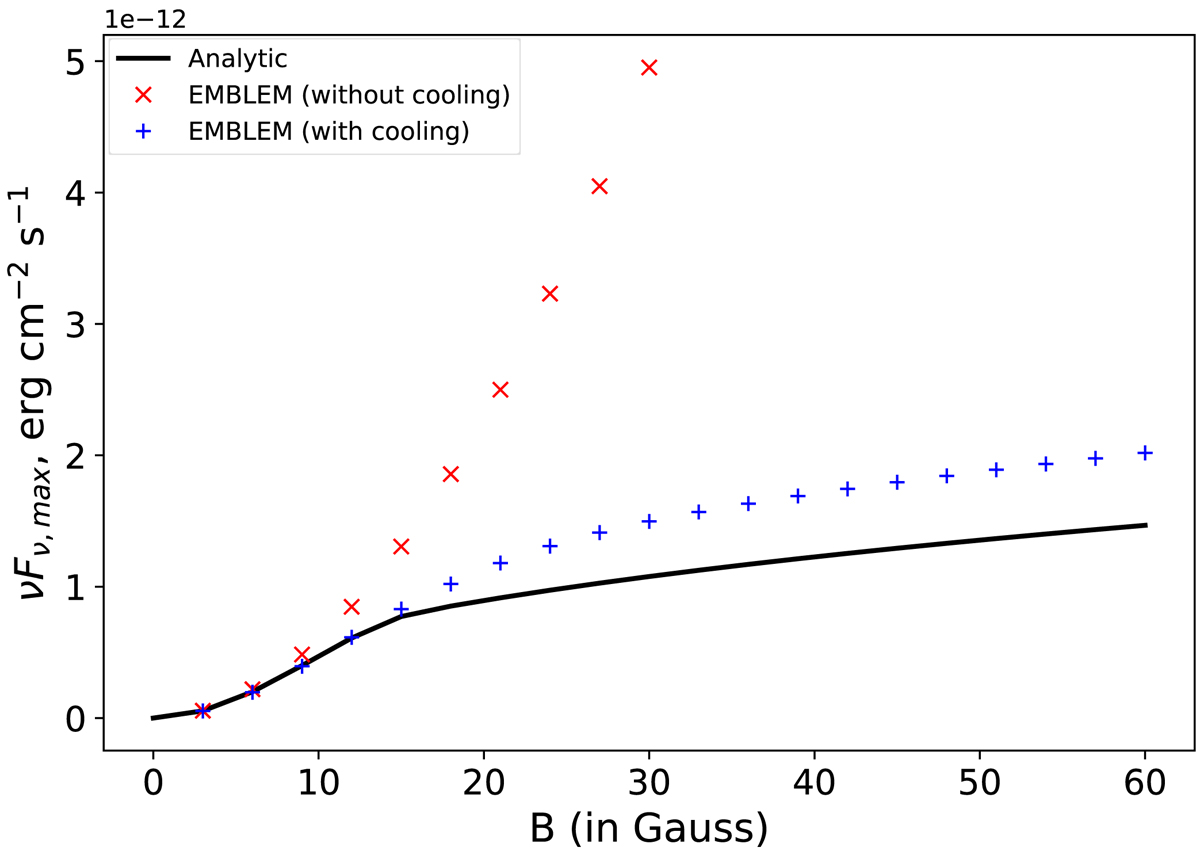
Fig. C.3.
Download original image
Evolution of the maximum flux νFν(tgrowth) (at the end of the growth phase tgrowth = 75 rg/c) as a function of the magnetic field. We show the results of EMBLEM without cooling (red crosses) as in Fig. C.2. Allowing the cooling during the growth phase results in a lower maximum flux (blue crosses). The maximum flux with cooling can be estimated through Eq. C.8 (black line) which is divided in two regimes, the equilibrium regime where the magnetic field is strong enough to compensate the injection and creates a stationary state (B ≥ 16.2 G) and nonstationary regime where not all electrons has cooled at tgrowth (B < 16.2 G). The relative error between the analytical formula and the results of EMBLEM (with cooling) is below 30% in the whole domain and below 7% in the nonstationary regime.
Current usage metrics show cumulative count of Article Views (full-text article views including HTML views, PDF and ePub downloads, according to the available data) and Abstracts Views on Vision4Press platform.
Data correspond to usage on the plateform after 2015. The current usage metrics is available 48-96 hours after online publication and is updated daily on week days.
Initial download of the metrics may take a while.