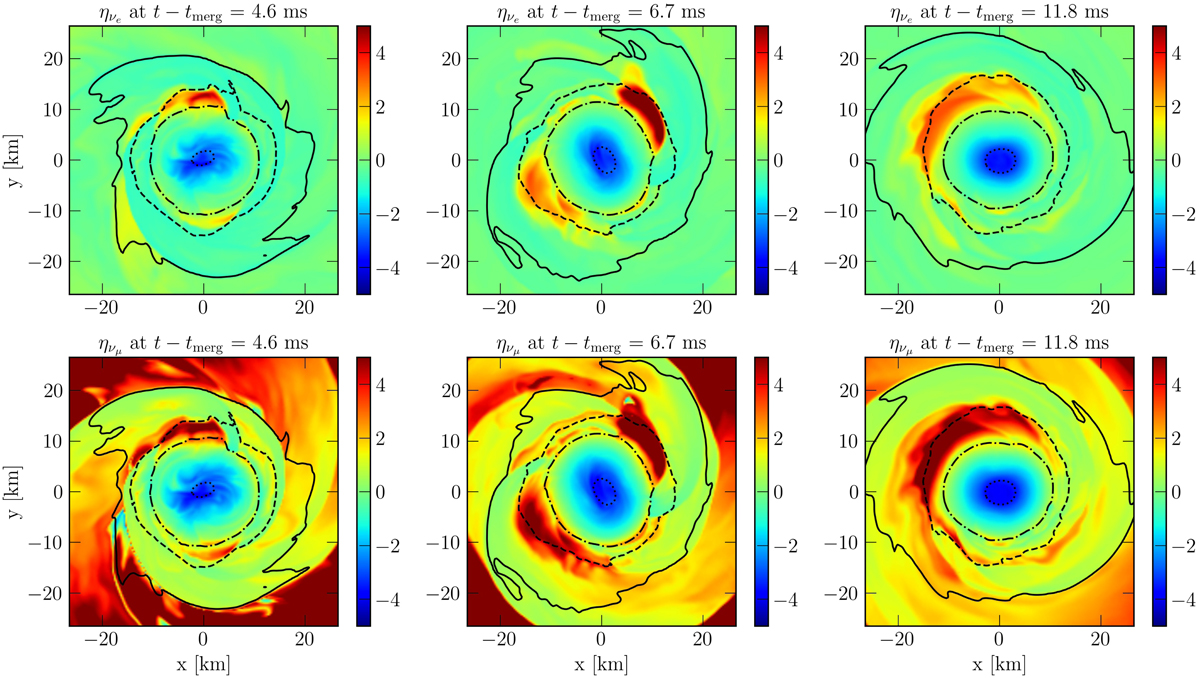
Fig. 7.
Download original image
Degeneracy parameter of νe (first row) and νμ (lower row) on the equatorial plane obtained by post-processing the simulation (BLh, 1.00). Three different time slices are shown corresponding from left to right to 4.6 ms, 6.7 ms, and 11.8 ms after merger. As in Fig. 1, the black lines mark the isodensity contours as in Fig. 1.
Current usage metrics show cumulative count of Article Views (full-text article views including HTML views, PDF and ePub downloads, according to the available data) and Abstracts Views on Vision4Press platform.
Data correspond to usage on the plateform after 2015. The current usage metrics is available 48-96 hours after online publication and is updated daily on week days.
Initial download of the metrics may take a while.