Fig. D.1
Download original image
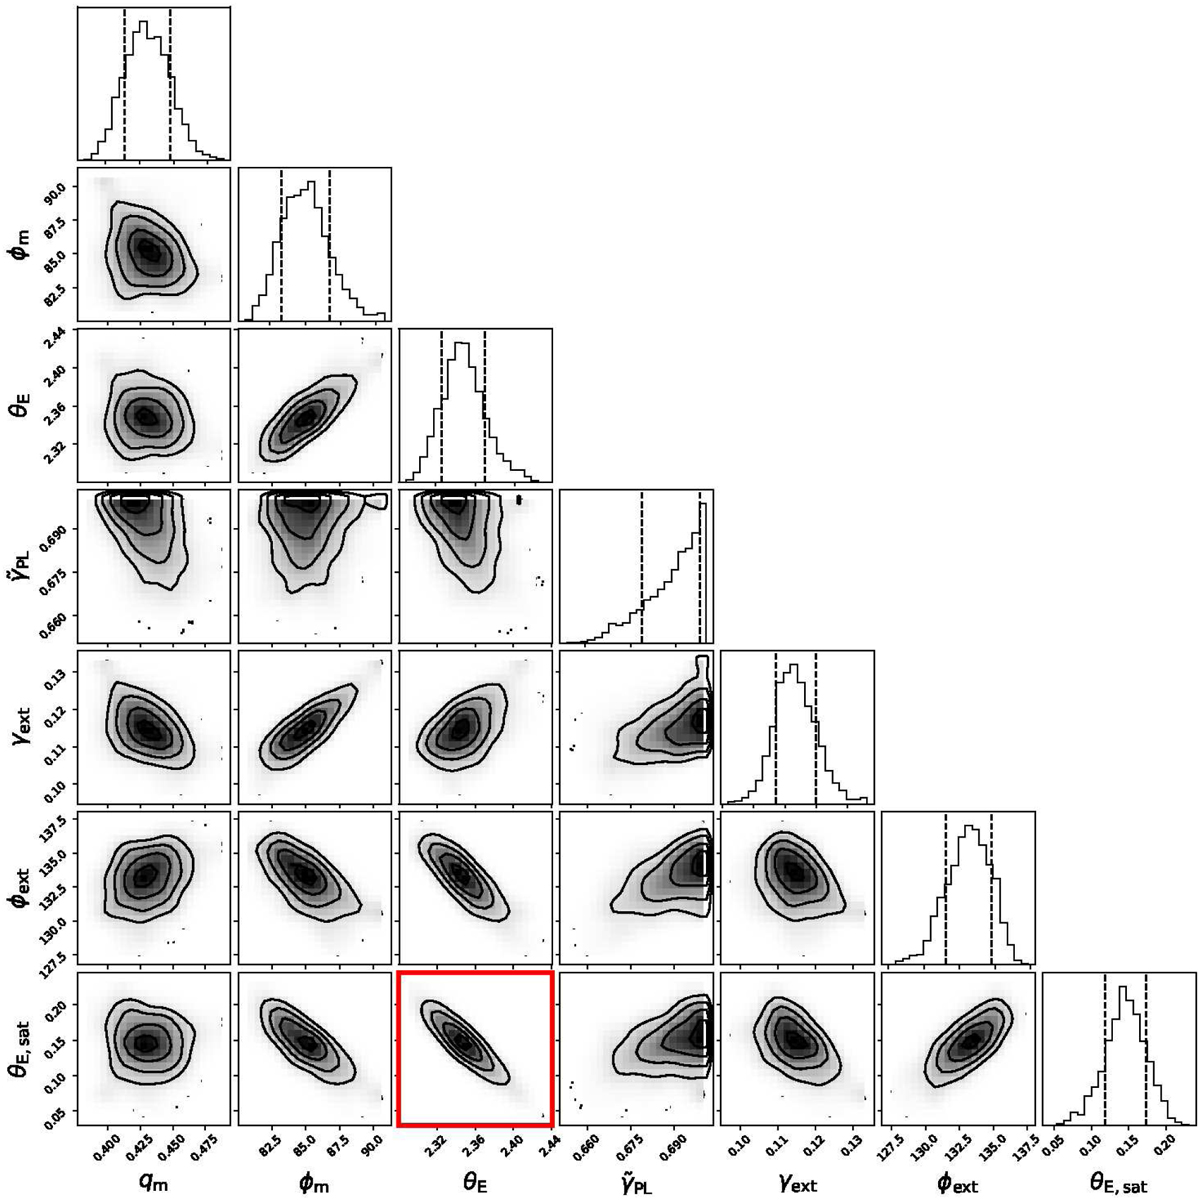
Posterior distributions for the main mass parameters and external shear of J0659+1629. The correlation between the Einstein radius of the lens and the satellite is highlighted in red. The three shaded areas show the 1, 2, and 3σ credible regions. The one-dimensional histograms show the marginalized posterior distribution for the selected mass parameters, and the vertical lines mark the 1σ confidence intervals.
Current usage metrics show cumulative count of Article Views (full-text article views including HTML views, PDF and ePub downloads, according to the available data) and Abstracts Views on Vision4Press platform.
Data correspond to usage on the plateform after 2015. The current usage metrics is available 48-96 hours after online publication and is updated daily on week days.
Initial download of the metrics may take a while.