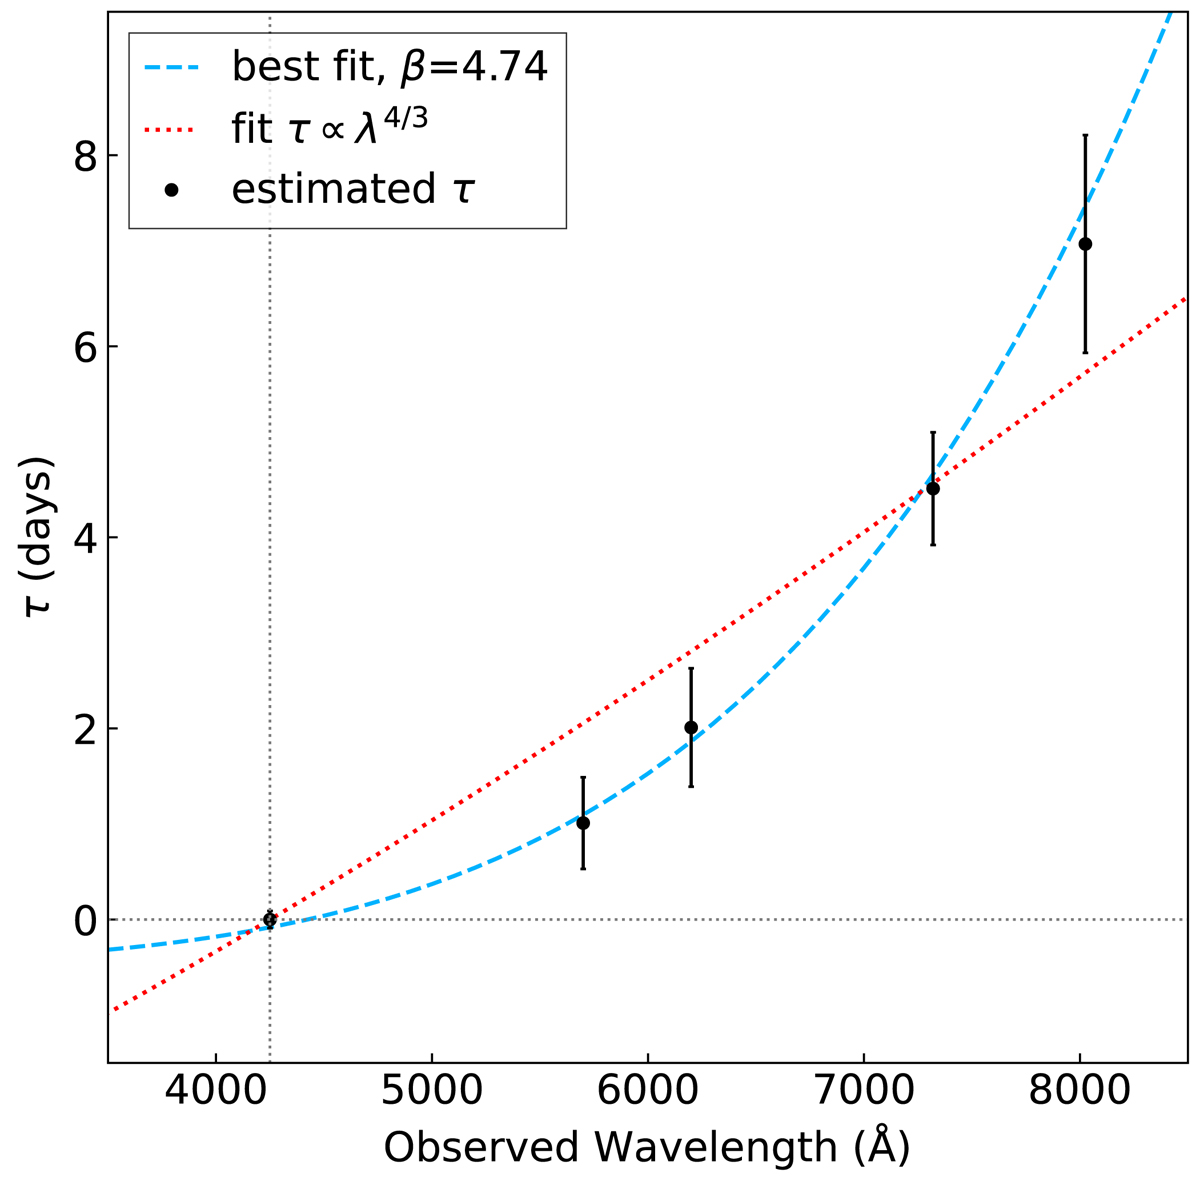
Fig. 5.
Download original image
Mean time lags (black circles) between multiband continuum light curves as a function of wavelength. All lags are measured relative to variations at 4250 Å. The dashed blue line shows the best fit to the observed relation τ = τ0/ [(λ/λ0) β − y0], with τ0, β, and y0 as free parameters (these values are presented in Table 5). The red dotted line is a fit with fixed theoretical power-law index β = 4/3, as expected for an optically thick and geometrically thin disk.
Current usage metrics show cumulative count of Article Views (full-text article views including HTML views, PDF and ePub downloads, according to the available data) and Abstracts Views on Vision4Press platform.
Data correspond to usage on the plateform after 2015. The current usage metrics is available 48-96 hours after online publication and is updated daily on week days.
Initial download of the metrics may take a while.