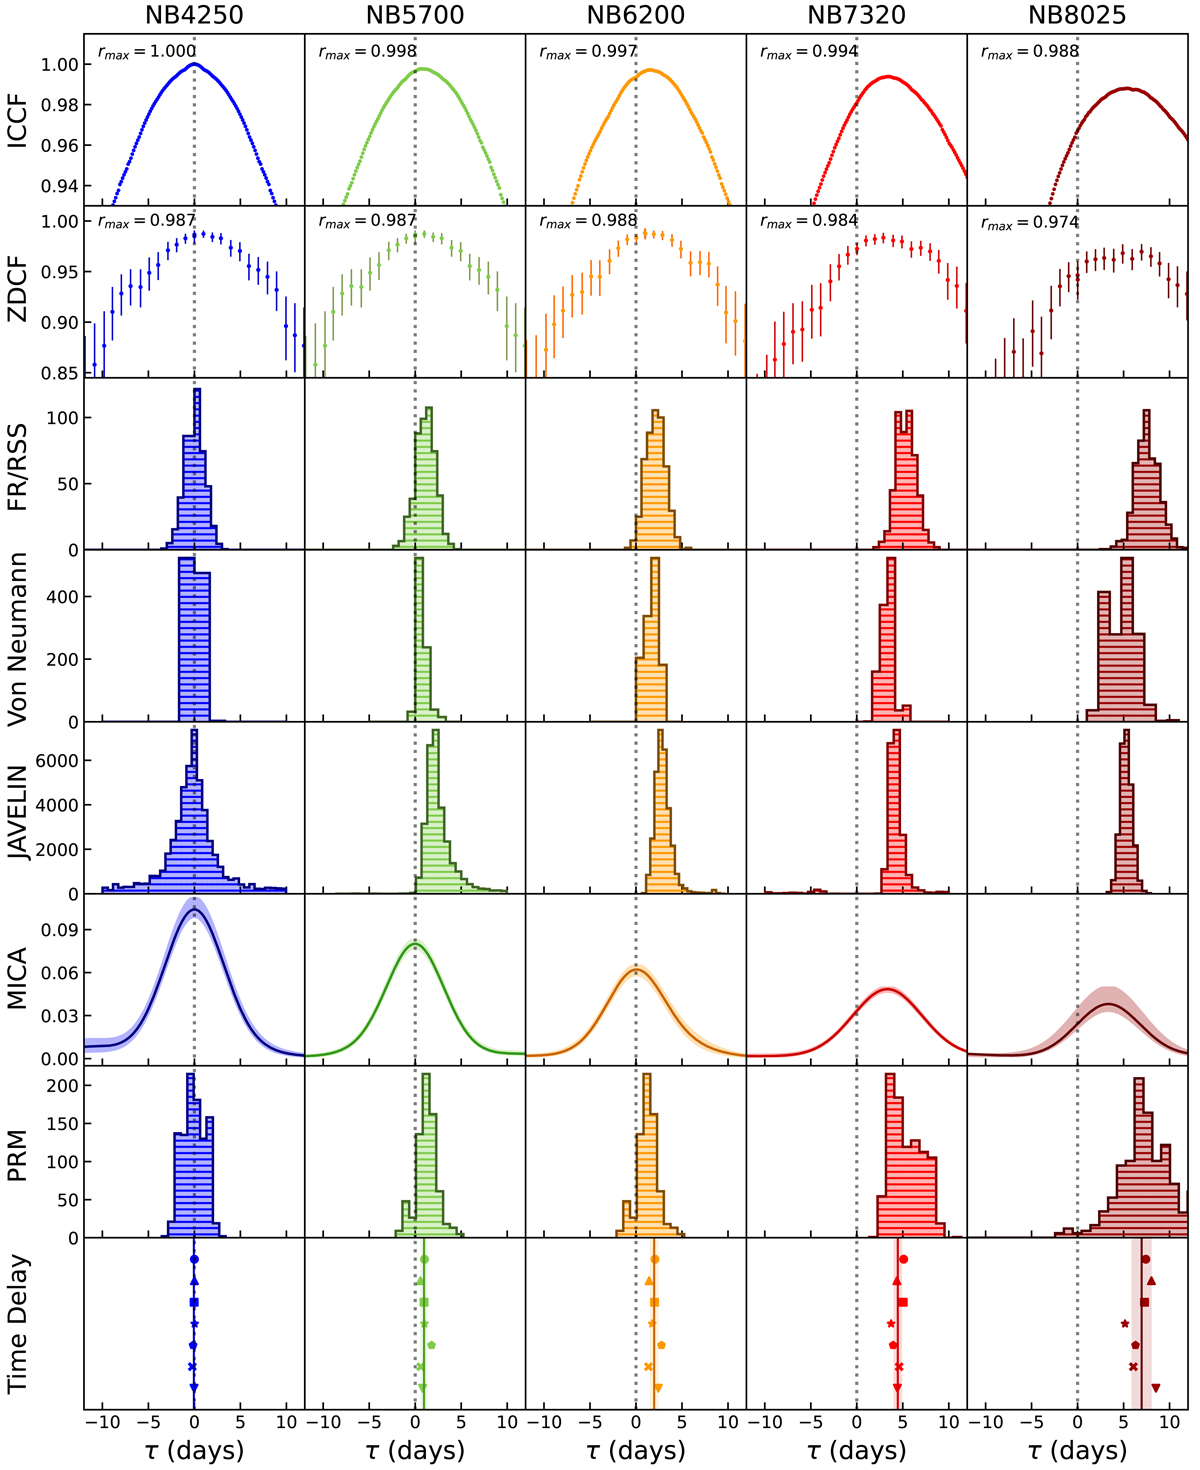
Fig. 3.
Download original image
From top to bottom: partially interpolated CCFs, z-transformed DCFs, FR/RSS centroid distributions (for centroid ≥0.8 rmax), von Neuman estimator peak distributions, JAVELIN posterior distributions of lags (spectroscopic mode), MICA transfer functions, and PRM lag distributions for each NB relative to the 4250 Å band. In the bottom panel all time delays are plotted (in the same order as described before) on a vertical axis for illustration. The solid lines show the mean time delay of all methods together, and the shaded regions represent the corresponding standard deviation. These values are presented in Table 4.
Current usage metrics show cumulative count of Article Views (full-text article views including HTML views, PDF and ePub downloads, according to the available data) and Abstracts Views on Vision4Press platform.
Data correspond to usage on the plateform after 2015. The current usage metrics is available 48-96 hours after online publication and is updated daily on week days.
Initial download of the metrics may take a while.