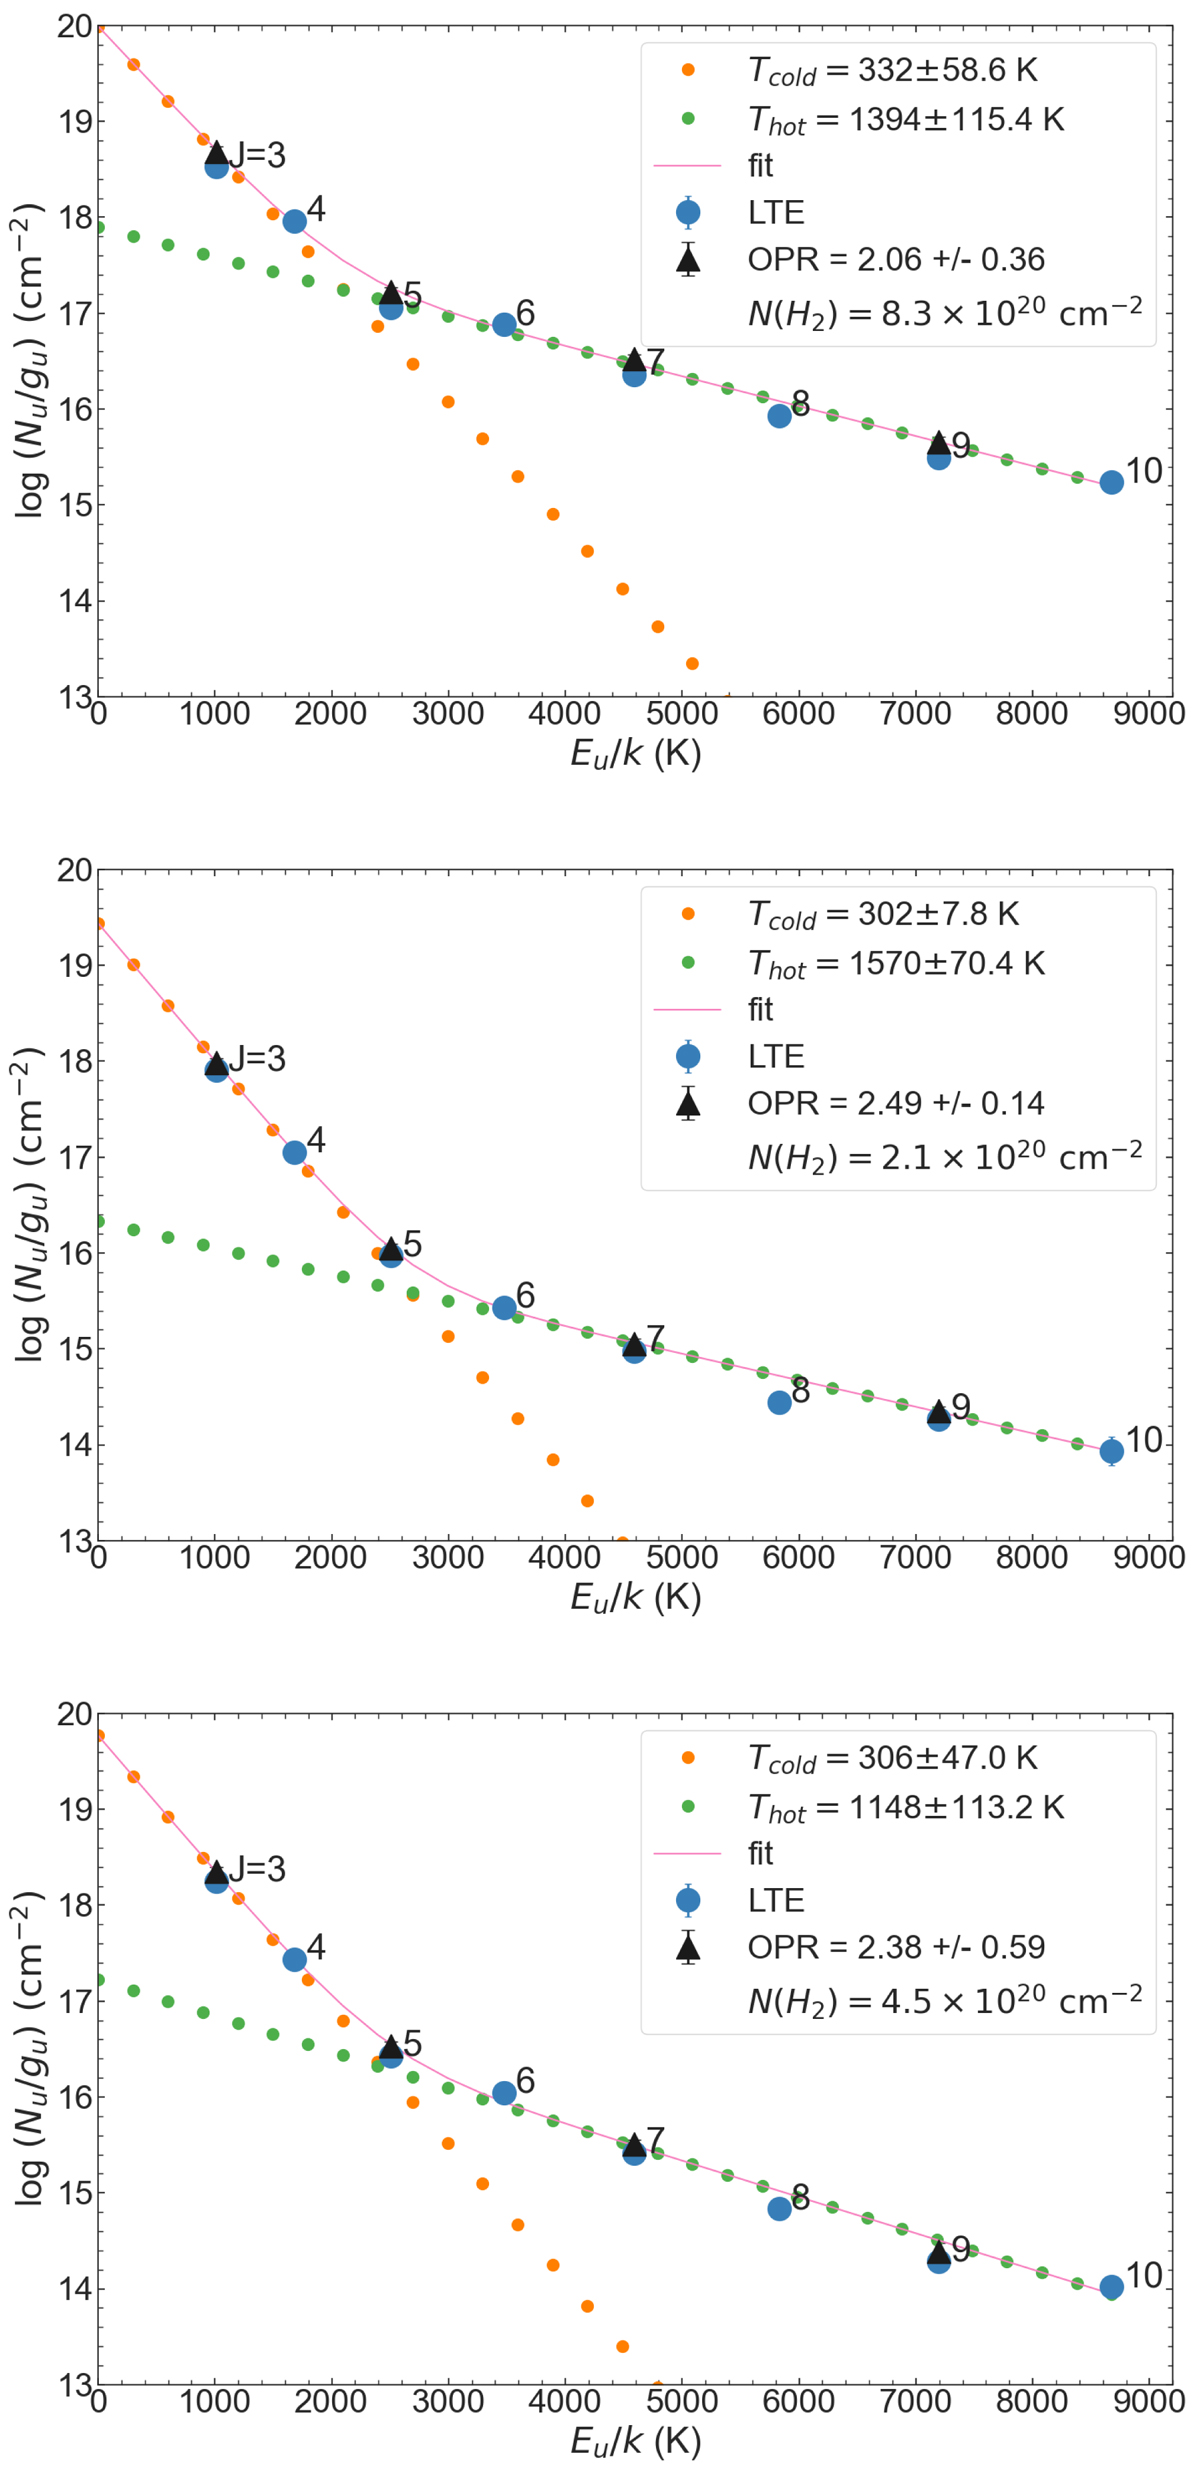
Fig. 6.
Download original image
NGC 6552 H2 excitation diagrams of the three extracted regions (top: nucleus, middle: circumnuclear, and bottom: central). The logarithm of the column densities divided by the statistical weights of the different transitions are plotted against the upper level energies of those transitions. The LTE and fitted-OPR column densities are both displayed: the blue circles are the original column densities with LTE gu, assuming OPR = 3, while the black triangles represent the column densities calculated using the fitted OPR (see Sect. 5.3 for details). The H2 temperatures, column densities, and masses are listed in Table 4.
Current usage metrics show cumulative count of Article Views (full-text article views including HTML views, PDF and ePub downloads, according to the available data) and Abstracts Views on Vision4Press platform.
Data correspond to usage on the plateform after 2015. The current usage metrics is available 48-96 hours after online publication and is updated daily on week days.
Initial download of the metrics may take a while.