Fig. 5.
Download original image
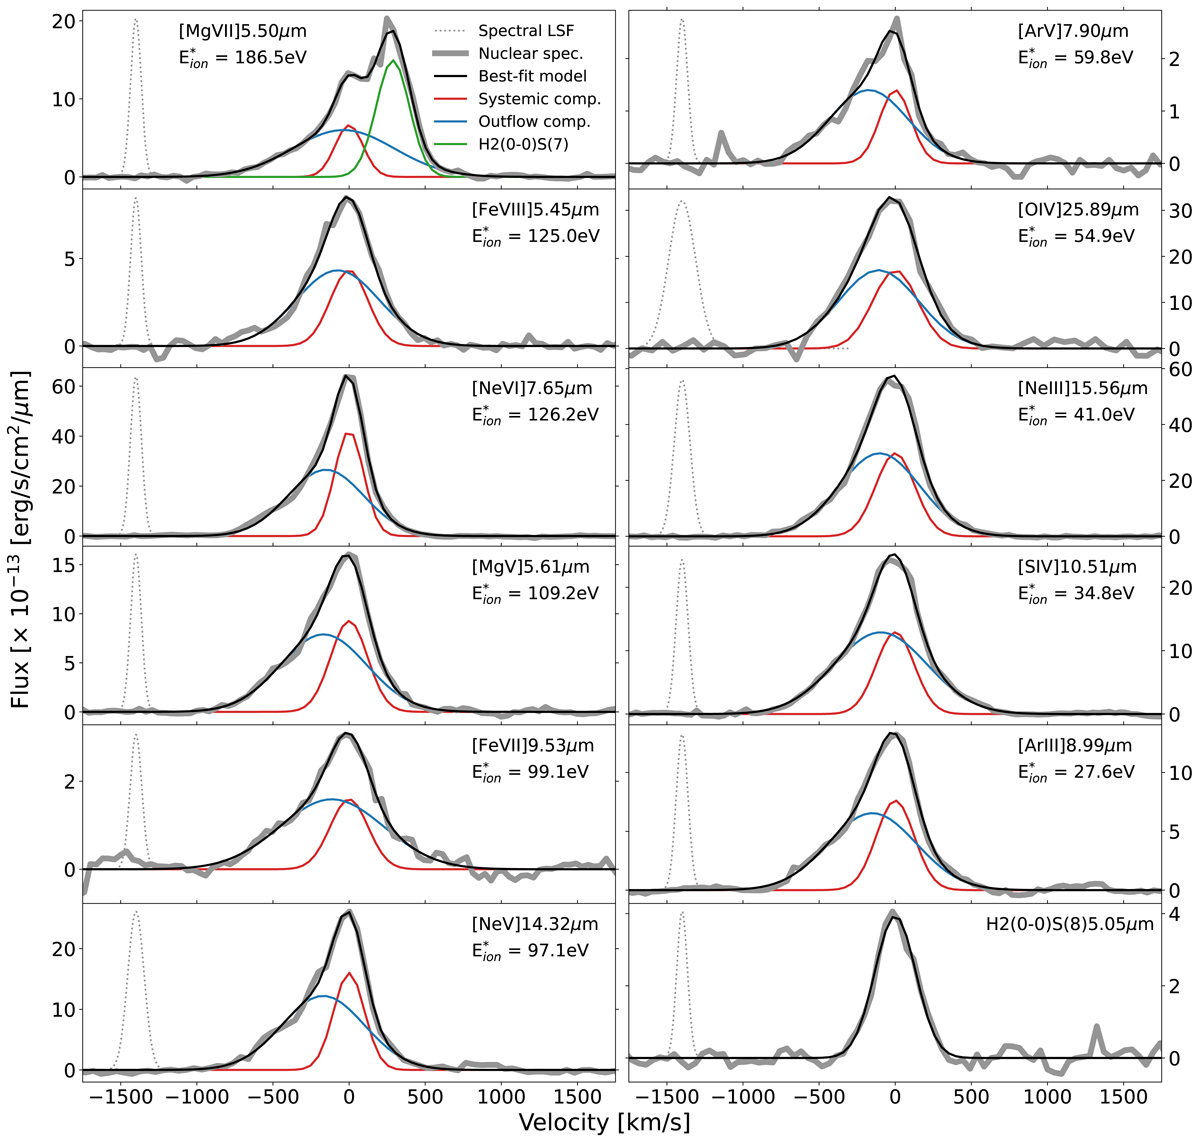
Characterisation of line profiles of high-excitation and coronal emission lines in the nuclear spectrum of NGC 6552. The two-component Gaussian fit of eleven coronal emission lines covering ionisation potential from 27.6 to 186.5 eV is shown. If more than two emission lines trace the same ion (e.g., [NeV] at 14 and 24 μm), only the line with the highest spectral resolution is shown. For comparison, the bottom-right panel illustrates the one-component Gaussian fit of the H2(0-0)S(8) hydrogen molecular line. Gray line shows the nuclear spectrum of NGC 6552. Black line is the best line-fit model. Red line is the systemic component. Blue line is the outflow component. Dotted gray line is the unresolved emission line for the corresponding wavelength. All systemic and outflow components of high-excitation and coronal emission lines are consistent independently of the ionisation potential. The molecular hydrogen lines do not present an outflow component, and its line profiles are in agreement with the systemic component of all high-excitation and coronal emission lines.
Current usage metrics show cumulative count of Article Views (full-text article views including HTML views, PDF and ePub downloads, according to the available data) and Abstracts Views on Vision4Press platform.
Data correspond to usage on the plateform after 2015. The current usage metrics is available 48-96 hours after online publication and is updated daily on week days.
Initial download of the metrics may take a while.