Fig. 2.
Download original image
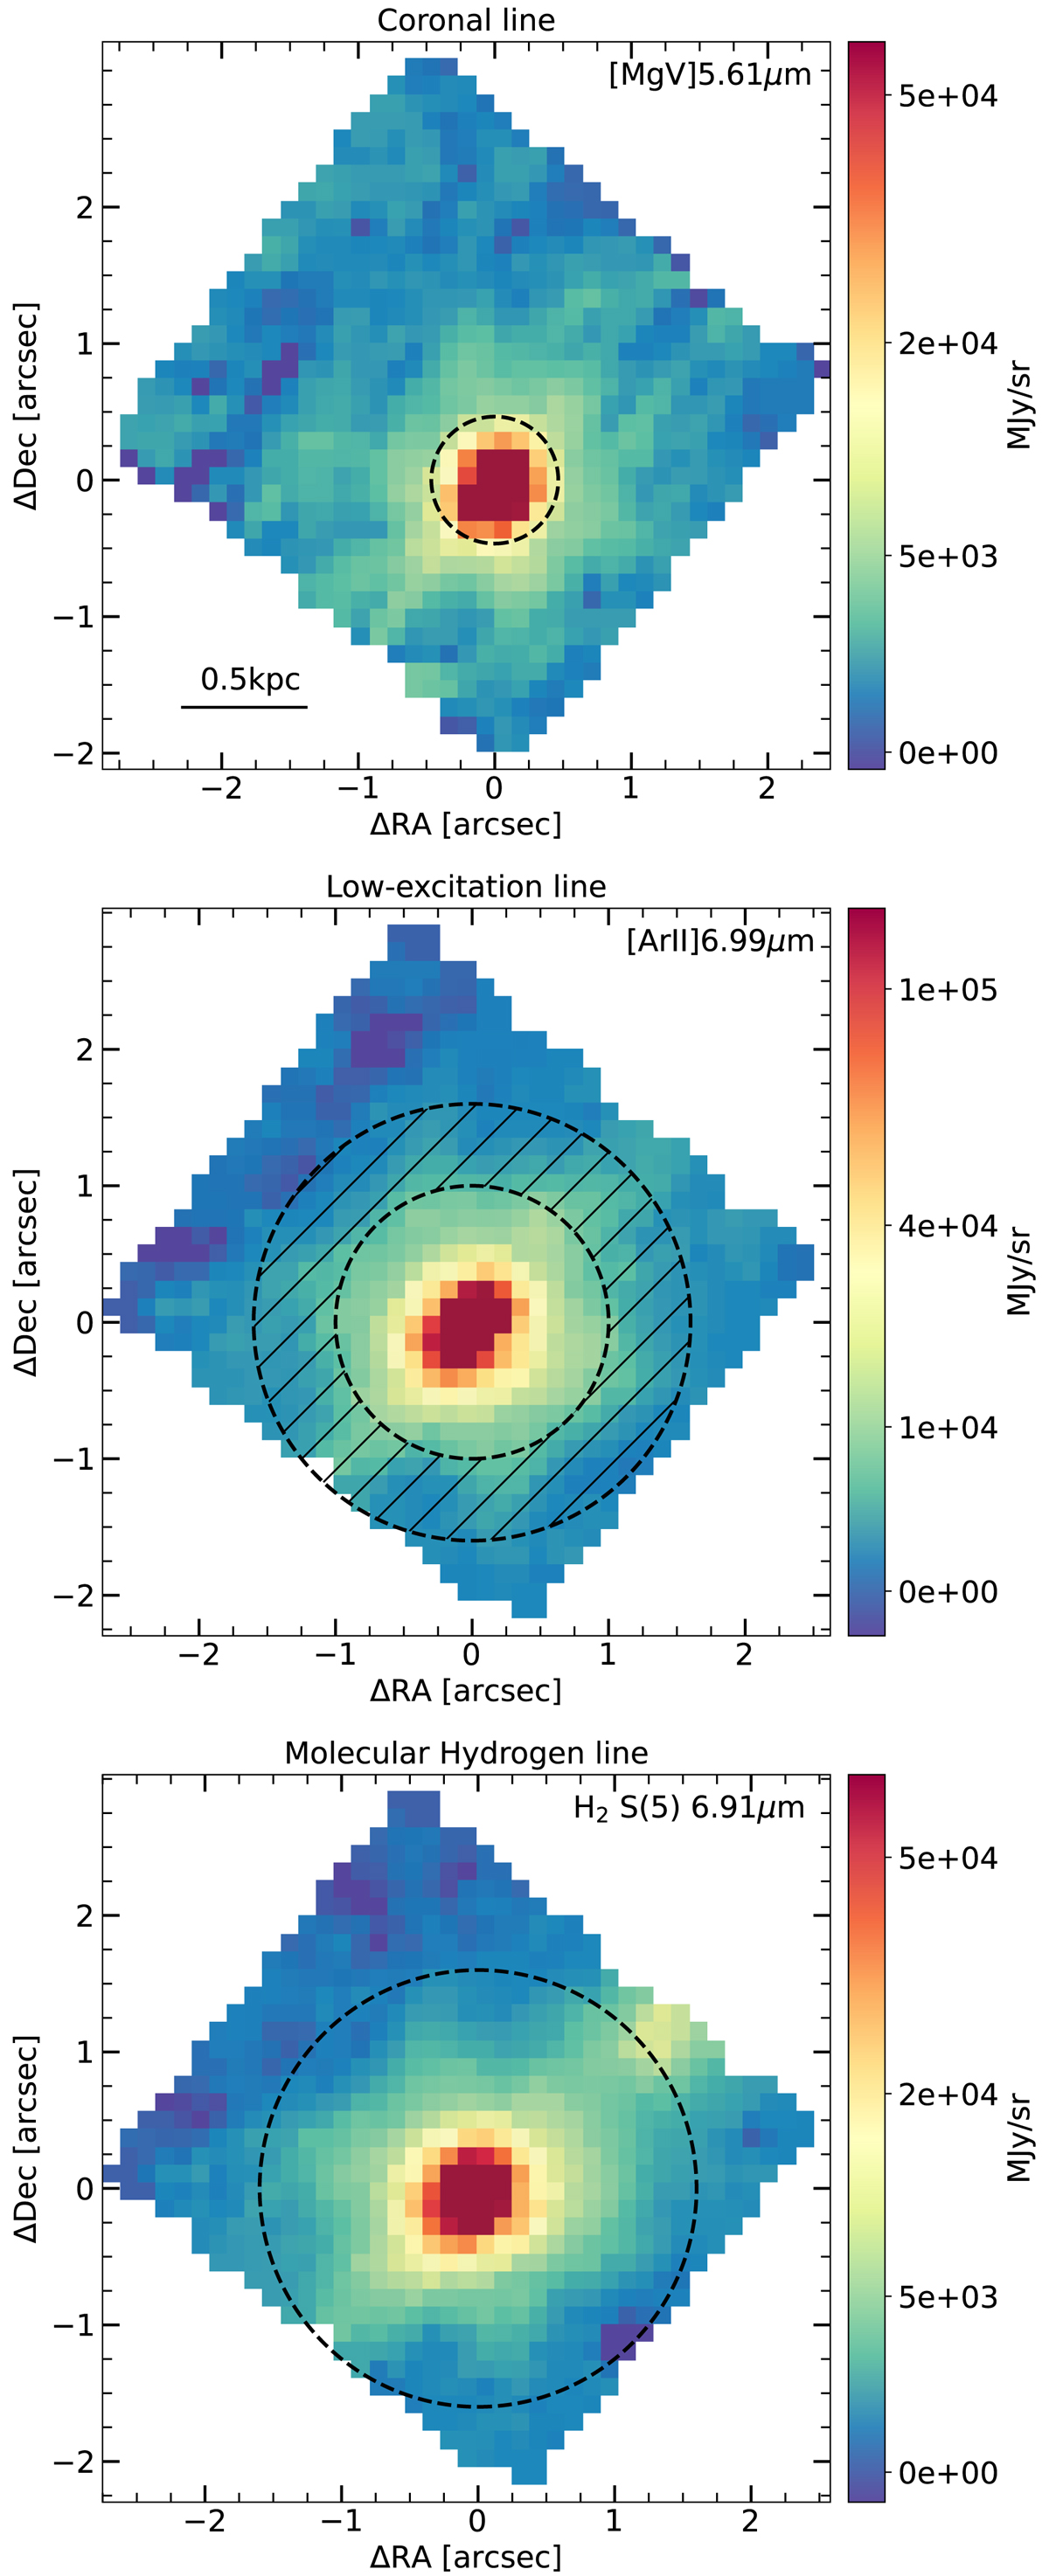
Emission line maps in the central region of NGC 6552 generated using the MRS channel 1 (3.2 × 3.7 arcsec). Upper panel: line map of [MgV]5.61 μm as a representation of a coronal line emission, and illustrate the aperture used to extract the nuclear spectrum of NGC 6552 in channel 1. Middle panel: line map of [ArII]6.99 μm as a representation of a low-excitation line emission, and illustrate the aperture used to extract the circumnuclear spectrum of NGC 6552. Bottom panel: line map of H2(0-0)S(5) as a representation of the molecular hydrogen line emission and an illustration of the aperture used to extract the central spectrum of NGC 6552.
Current usage metrics show cumulative count of Article Views (full-text article views including HTML views, PDF and ePub downloads, according to the available data) and Abstracts Views on Vision4Press platform.
Data correspond to usage on the plateform after 2015. The current usage metrics is available 48-96 hours after online publication and is updated daily on week days.
Initial download of the metrics may take a while.