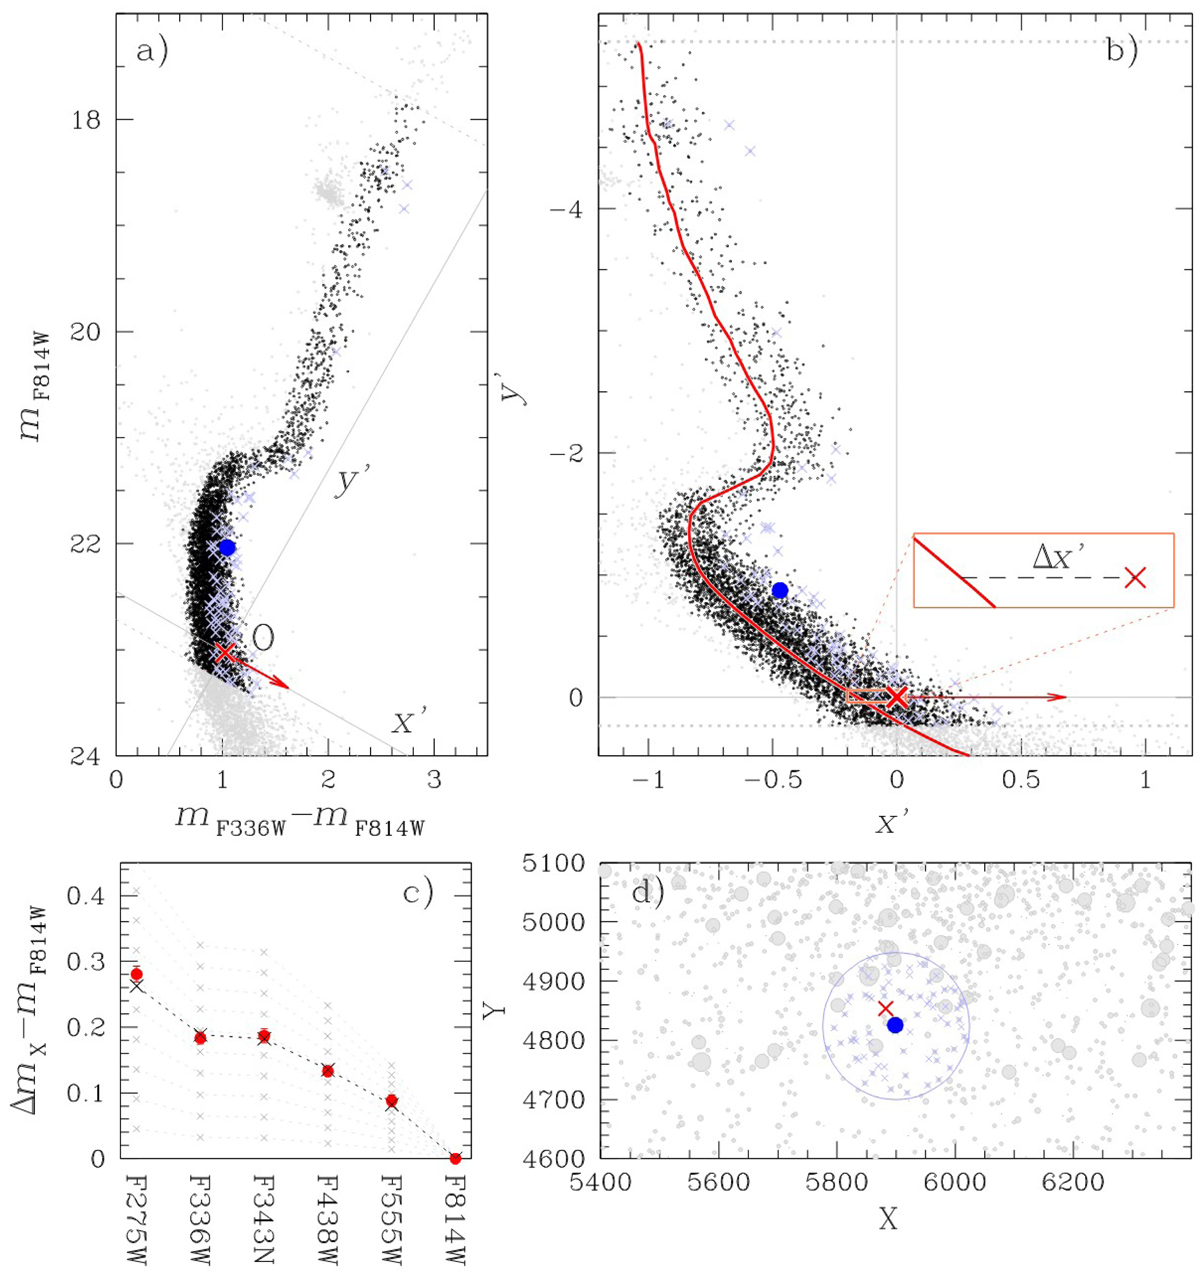
Fig. 5.
Download original image
Illustration of the procedure for estimating the amount of differential reddening associated with the target star, represented with the large blue dot. Panel a shows the mF814W vs. mF336W − mF814W CMD of all the stars. Reference stars, are located between the two dotted gray lines and are colored black, whereas the neighboring reference stars are marked with light blue crosses. The gray continuous lines are the abscissa and the ordinate of the rotated reference frame centered on the reference, which is star marked with the large red cross, while the red arrow indicates the reddening direction. Panel b shows the same stars as panel a but in the rotated reference frame. The red continuous line is the fiducial of reference stars, and the inset highlights the relative position between one reference star and the fiducial. Panel c shows the values of ΔX′ inferred from different filters (red dots). Gray crosses are the corresponding values derived for ΔE(B − V) and range from 0.01 to 0.10 mag in steps of 0.01 mag, while the black crosses provide the best fit to the observations and correspond to ΔE(B − V) = 0.058 mag. Finally, the finding chart zoomed in around the target is illustrated in panel d. See the text for details.
Current usage metrics show cumulative count of Article Views (full-text article views including HTML views, PDF and ePub downloads, according to the available data) and Abstracts Views on Vision4Press platform.
Data correspond to usage on the plateform after 2015. The current usage metrics is available 48-96 hours after online publication and is updated daily on week days.
Initial download of the metrics may take a while.