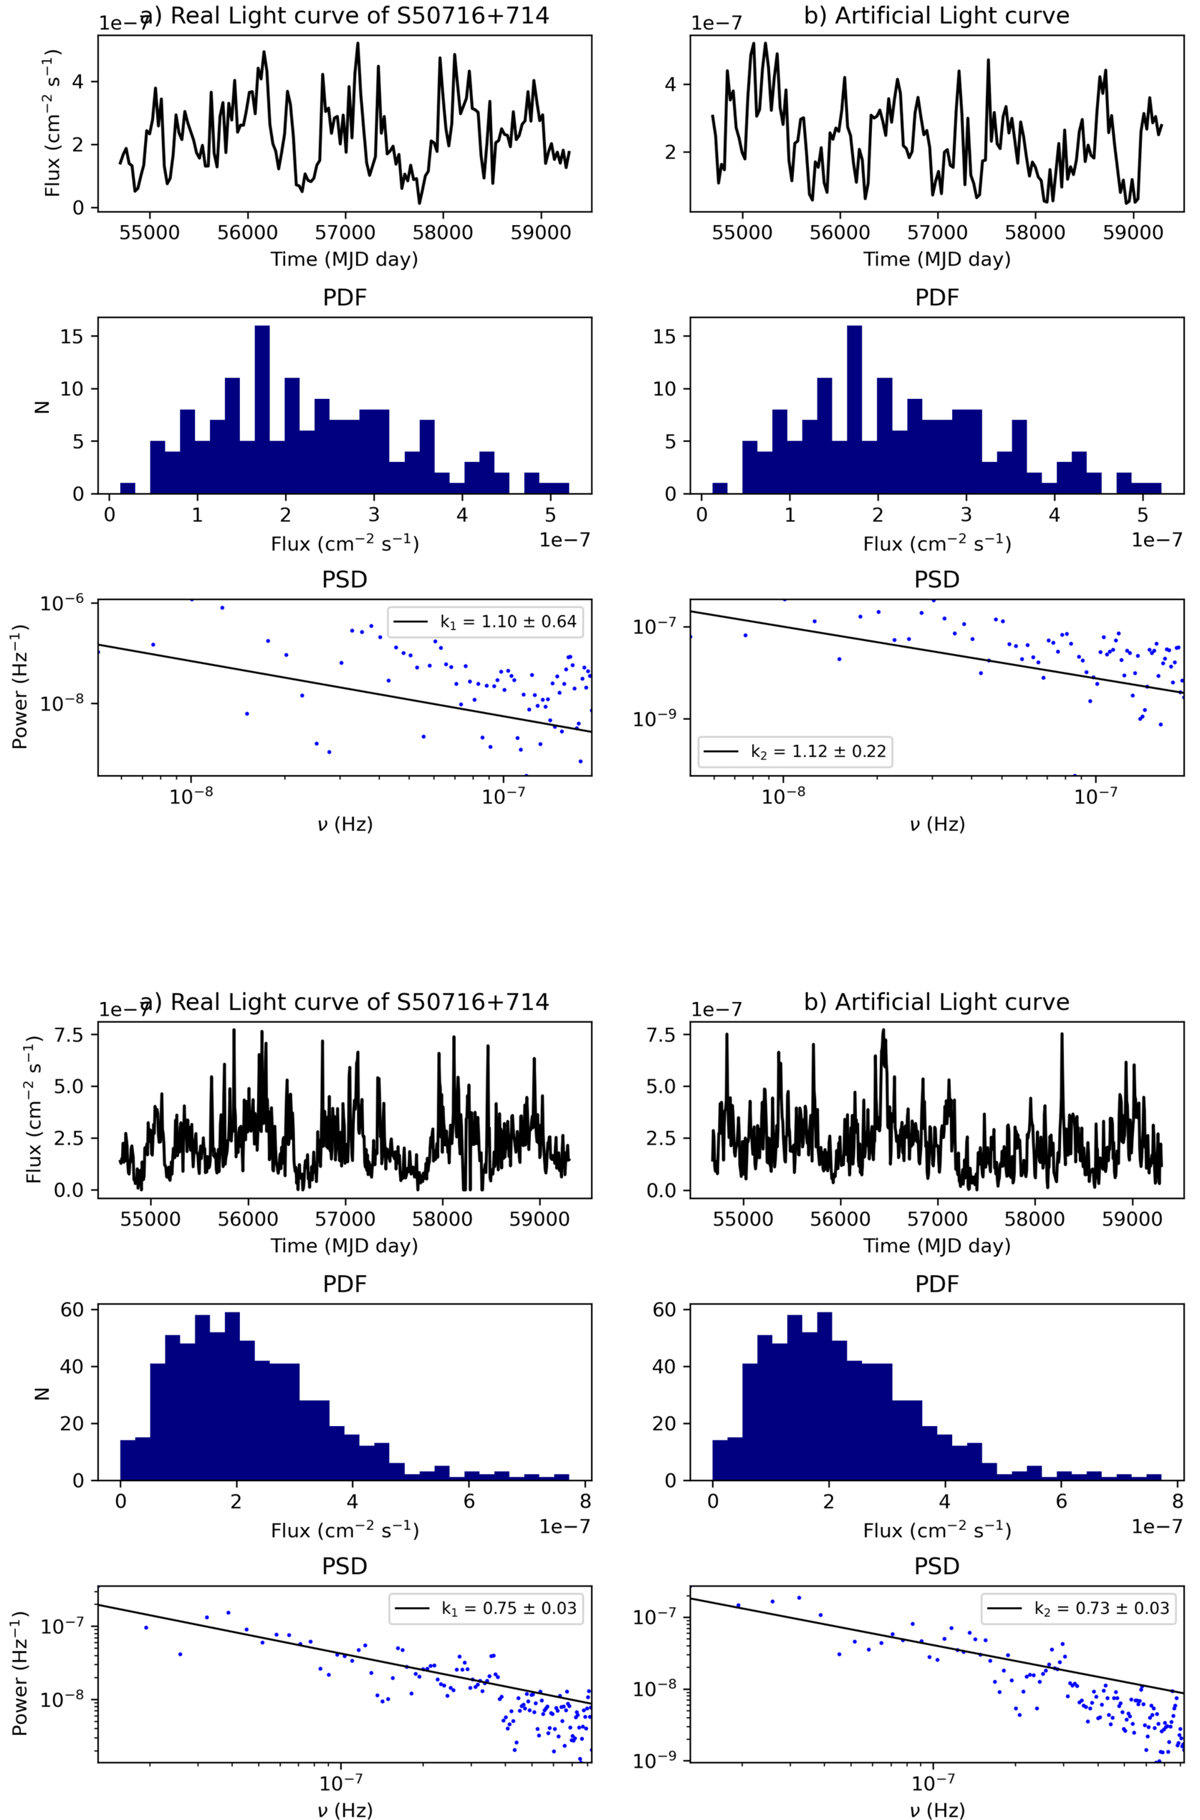
Fig. B.1.
Download original image
Comparison of the PDF and the PSD of the original light curve of the source S5 0716+714 and the light curve simulated by Connolly (2015), in time bins of 30 (upper) and 7 days (bottom). The solid line in the PSD is a simple power-law fit for a visual check. The actual fitted PSD is a smoothly bending power-law model plus a constant (see Eq. 2 in Emmanoulopoulos et al. 2013).
Current usage metrics show cumulative count of Article Views (full-text article views including HTML views, PDF and ePub downloads, according to the available data) and Abstracts Views on Vision4Press platform.
Data correspond to usage on the plateform after 2015. The current usage metrics is available 48-96 hours after online publication and is updated daily on week days.
Initial download of the metrics may take a while.