Open Access
Fig. A.3.
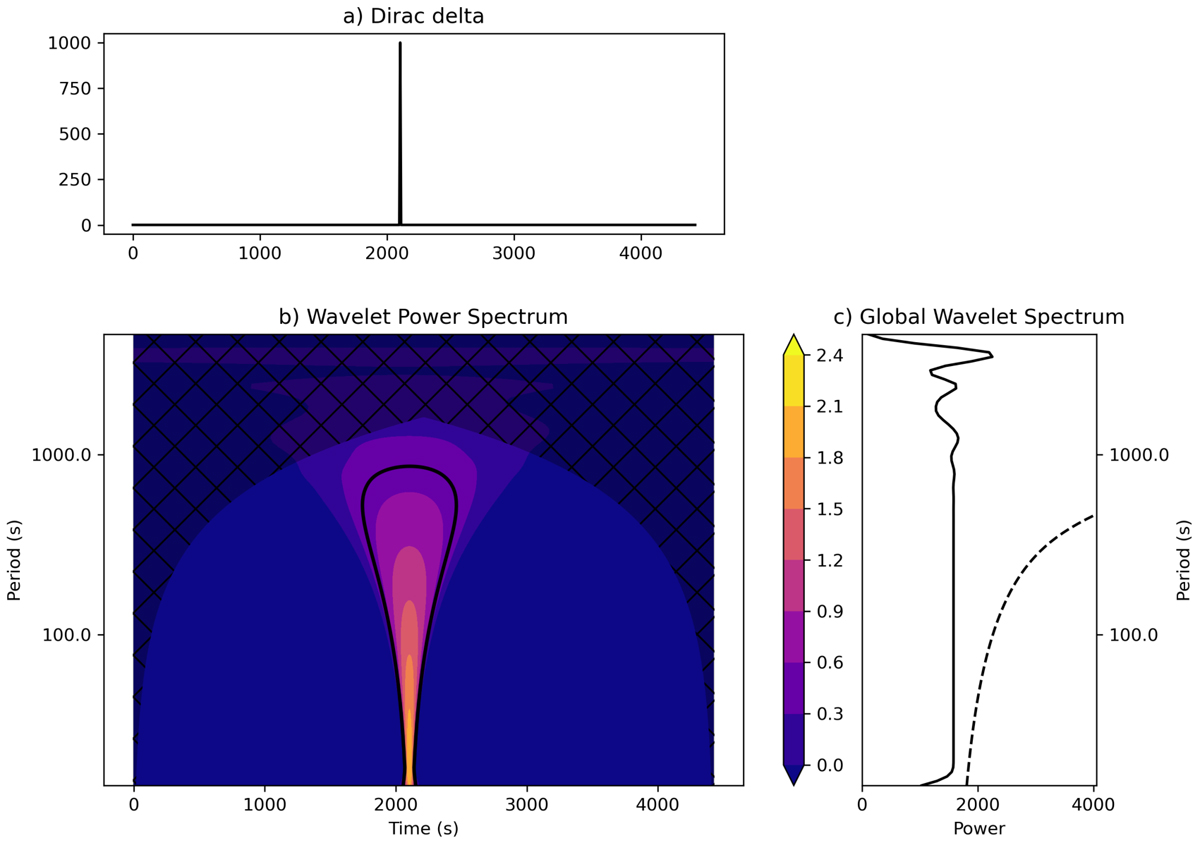
Download original image
CWT map for a Dirac Delta function. Each panel represents: a) Dirac delta function, b) corresponding wavelet power spectrum map obtained using PyCWT and c) global power spectrum in solid line and the significance level at 95% provided by PyCWT in dashed line. The dashed area in b) indicate the COI.
Current usage metrics show cumulative count of Article Views (full-text article views including HTML views, PDF and ePub downloads, according to the available data) and Abstracts Views on Vision4Press platform.
Data correspond to usage on the plateform after 2015. The current usage metrics is available 48-96 hours after online publication and is updated daily on week days.
Initial download of the metrics may take a while.