Fig. 4.
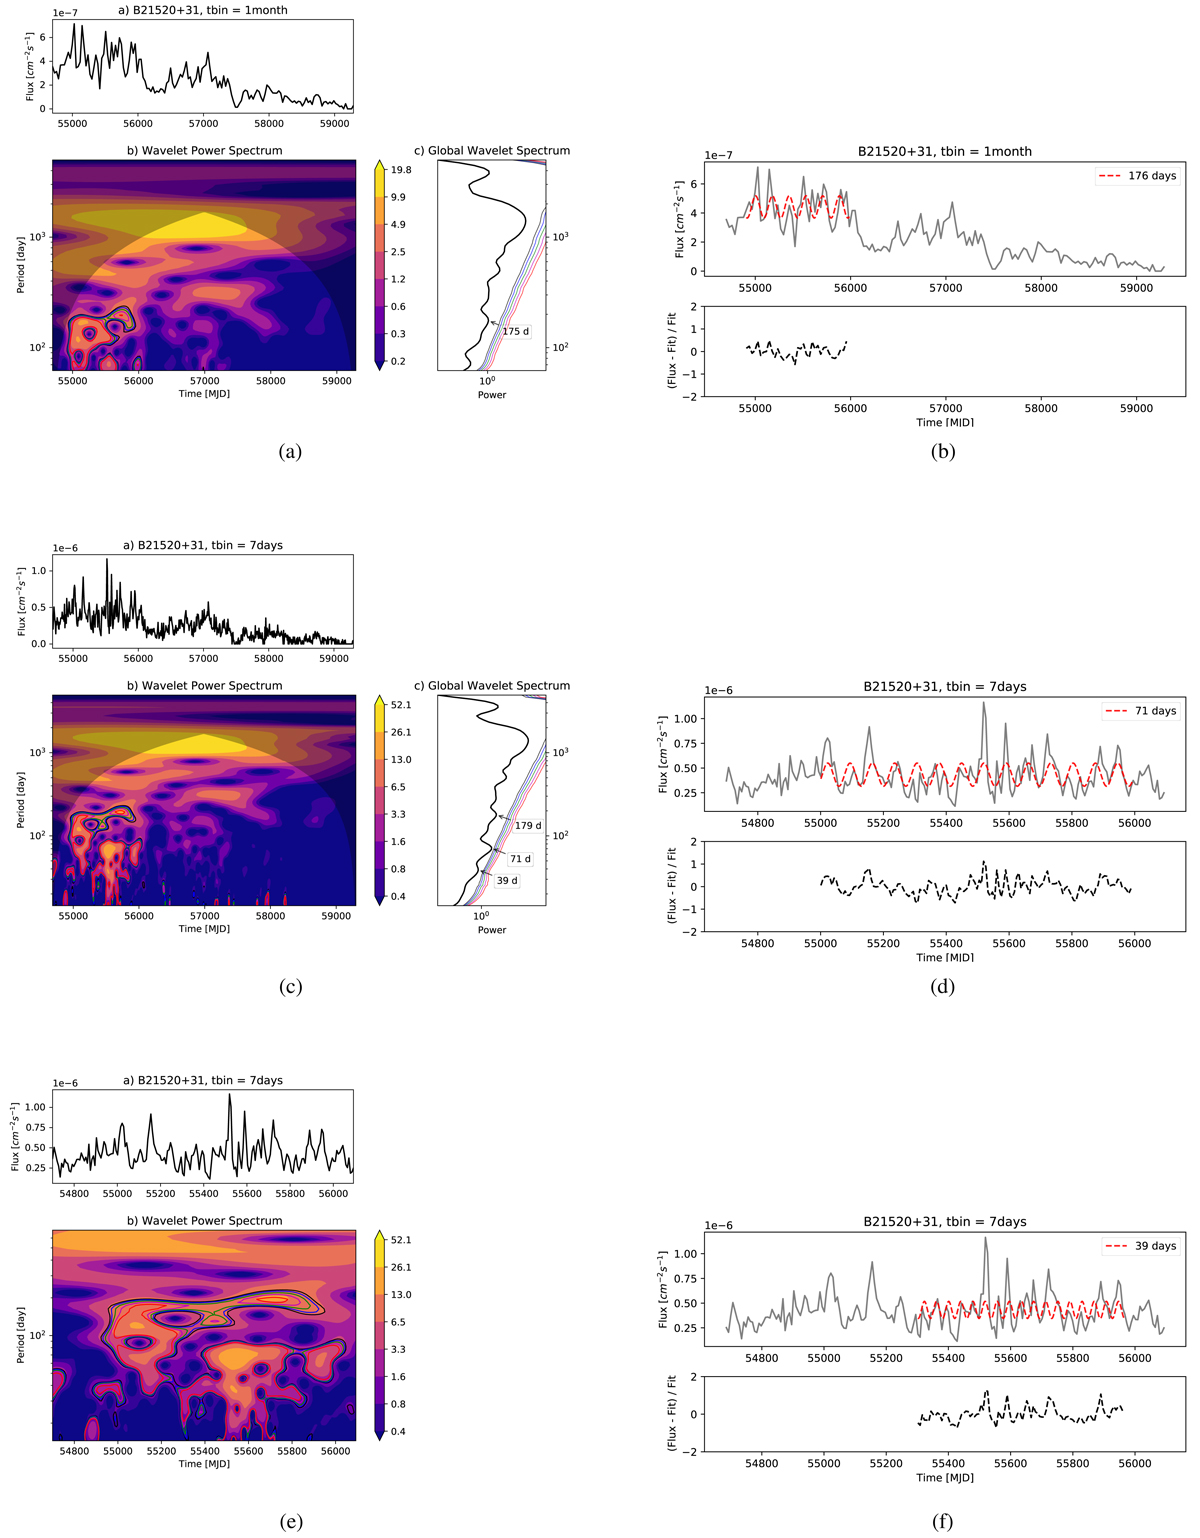
Download original image
CWT map for the monthly binned (upper) and the weekly binned light curve (middle) for B2 1520+31 (left). In each subplot, the panels represent (a) Fermi-LAT light curve, (b) wavelet power spectrum and (c) global wavelet power spectrum. The solid coloured contours in (b) and the dashed coloured lines in (c) are the confidence levels (1 to 5σ in black, blue, green, violet, and red). Monthly binned and weekly binned light curves with the fitted periodic signal in red dashed lines in the upper panels and the relative error in the bottom panels (right). The third CWT is computed with the weekly binned light curve cut from MJD 54697 to MJD 56100. And on the right, the respective fitted light curve shows the ∼39 d period.
Current usage metrics show cumulative count of Article Views (full-text article views including HTML views, PDF and ePub downloads, according to the available data) and Abstracts Views on Vision4Press platform.
Data correspond to usage on the plateform after 2015. The current usage metrics is available 48-96 hours after online publication and is updated daily on week days.
Initial download of the metrics may take a while.