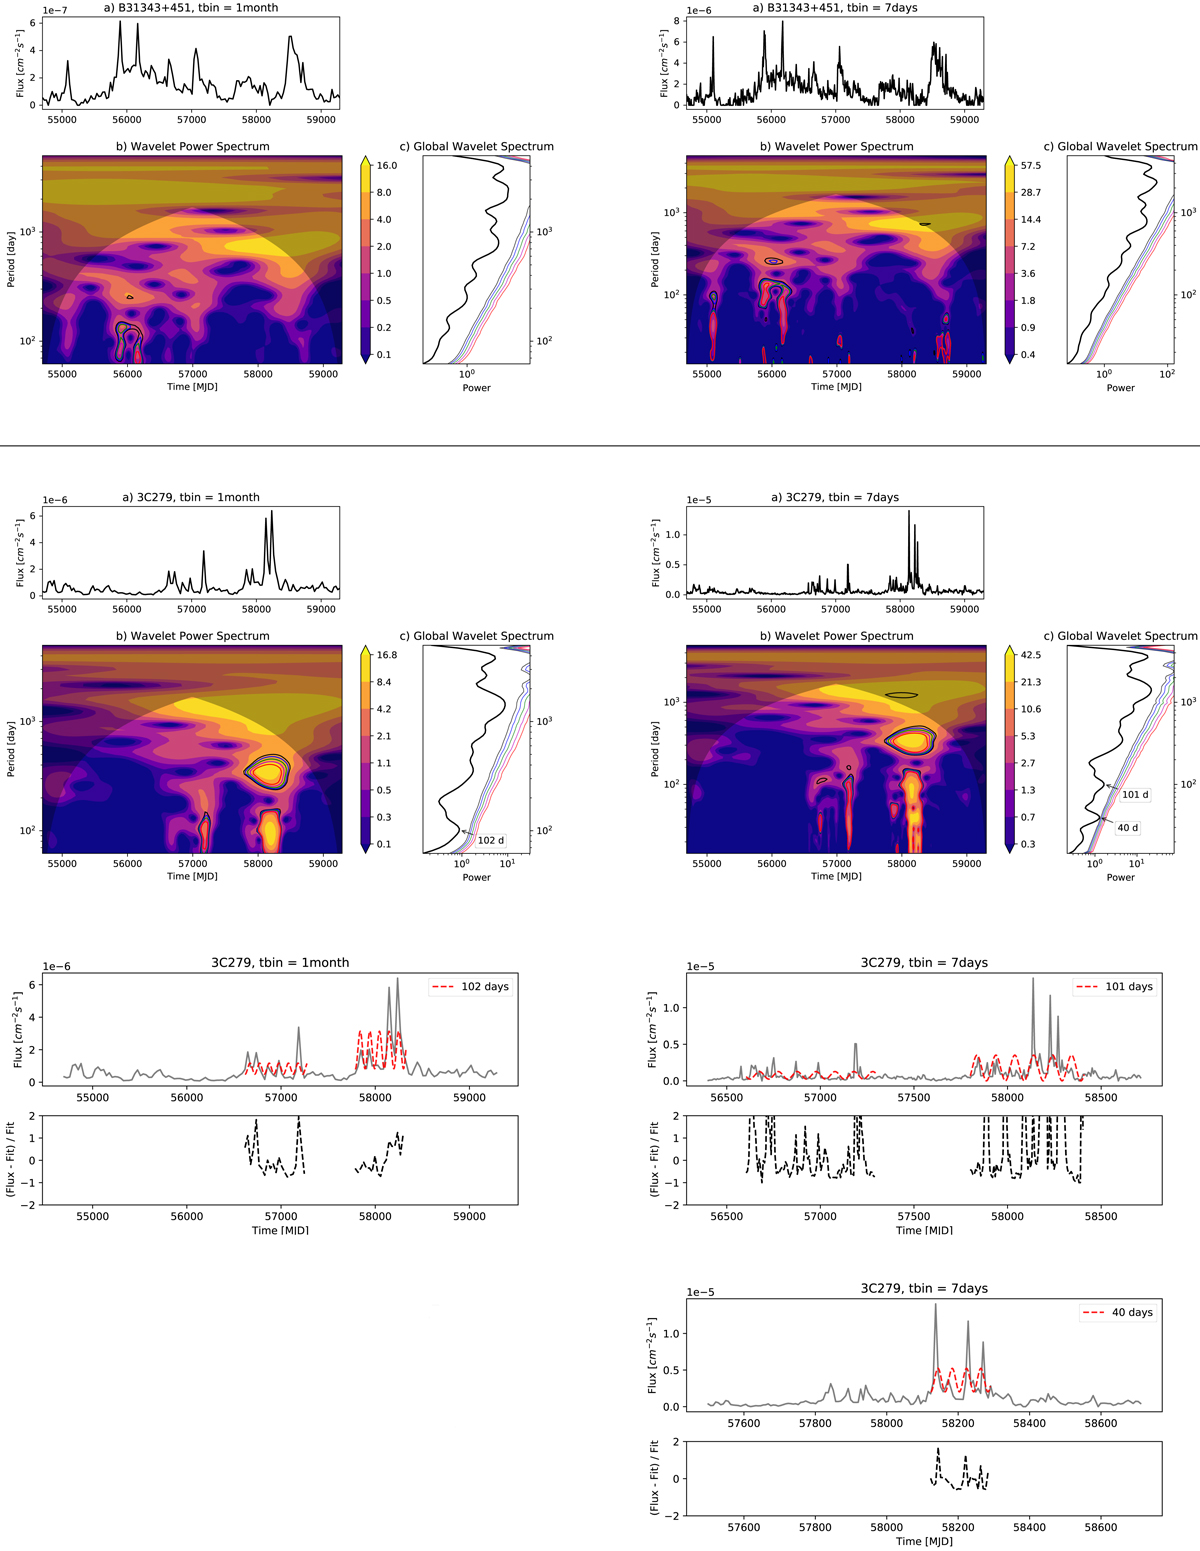
Fig. D.9.
Download original image
CWT map for monthly binned light curve (left) and weekly binned light curve (right) of B3 1343+451 and 3C 279, and the fitted light curves for 3C 279. The fitted light curve with period ∼101 d (third subfigure on the right hand side column) shows six cycles between around MJD 57700 and MJD 58400. However, we can fit six more cycles if we consider the previous rise in power spectrum during MJD 56500 and MJD 57300, approximately.
Current usage metrics show cumulative count of Article Views (full-text article views including HTML views, PDF and ePub downloads, according to the available data) and Abstracts Views on Vision4Press platform.
Data correspond to usage on the plateform after 2015. The current usage metrics is available 48-96 hours after online publication and is updated daily on week days.
Initial download of the metrics may take a while.