Fig. C.1.
Download original image
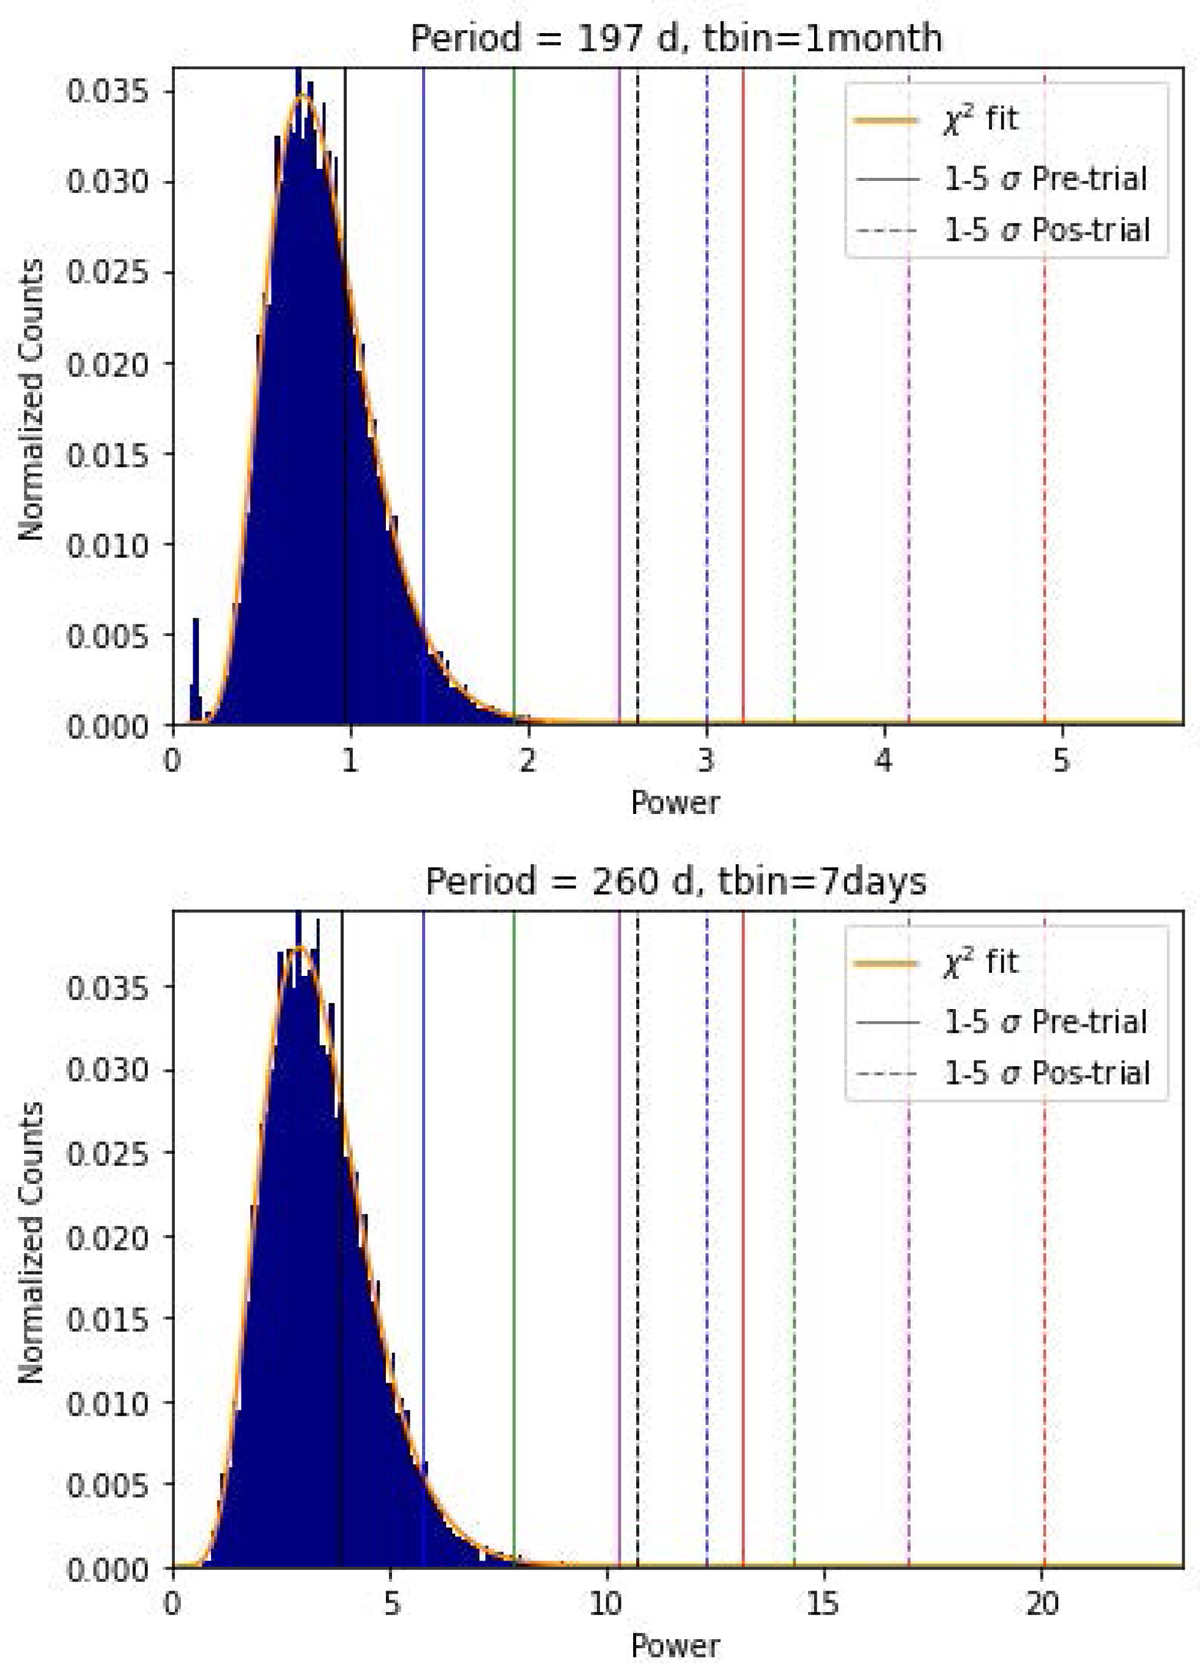
Global power spectrum histogram fitted with a χ2 function. The upper subfigure is the histogram for the monthly binned light curve of S5 0716+714, at the scale corresponding to period ∼197 d, and the bottom subfigure is the histogram for the weekly binned light curve, at the scale corresponding to period ∼260 d. Five pre-trial confidence levels are shown in both graphs corresponding to 1 to 5σ significance in solid lines, whereas the post-trial confidence levels are shown in dashed lines.
Current usage metrics show cumulative count of Article Views (full-text article views including HTML views, PDF and ePub downloads, according to the available data) and Abstracts Views on Vision4Press platform.
Data correspond to usage on the plateform after 2015. The current usage metrics is available 48-96 hours after online publication and is updated daily on week days.
Initial download of the metrics may take a while.