Fig. A.1
Download original image
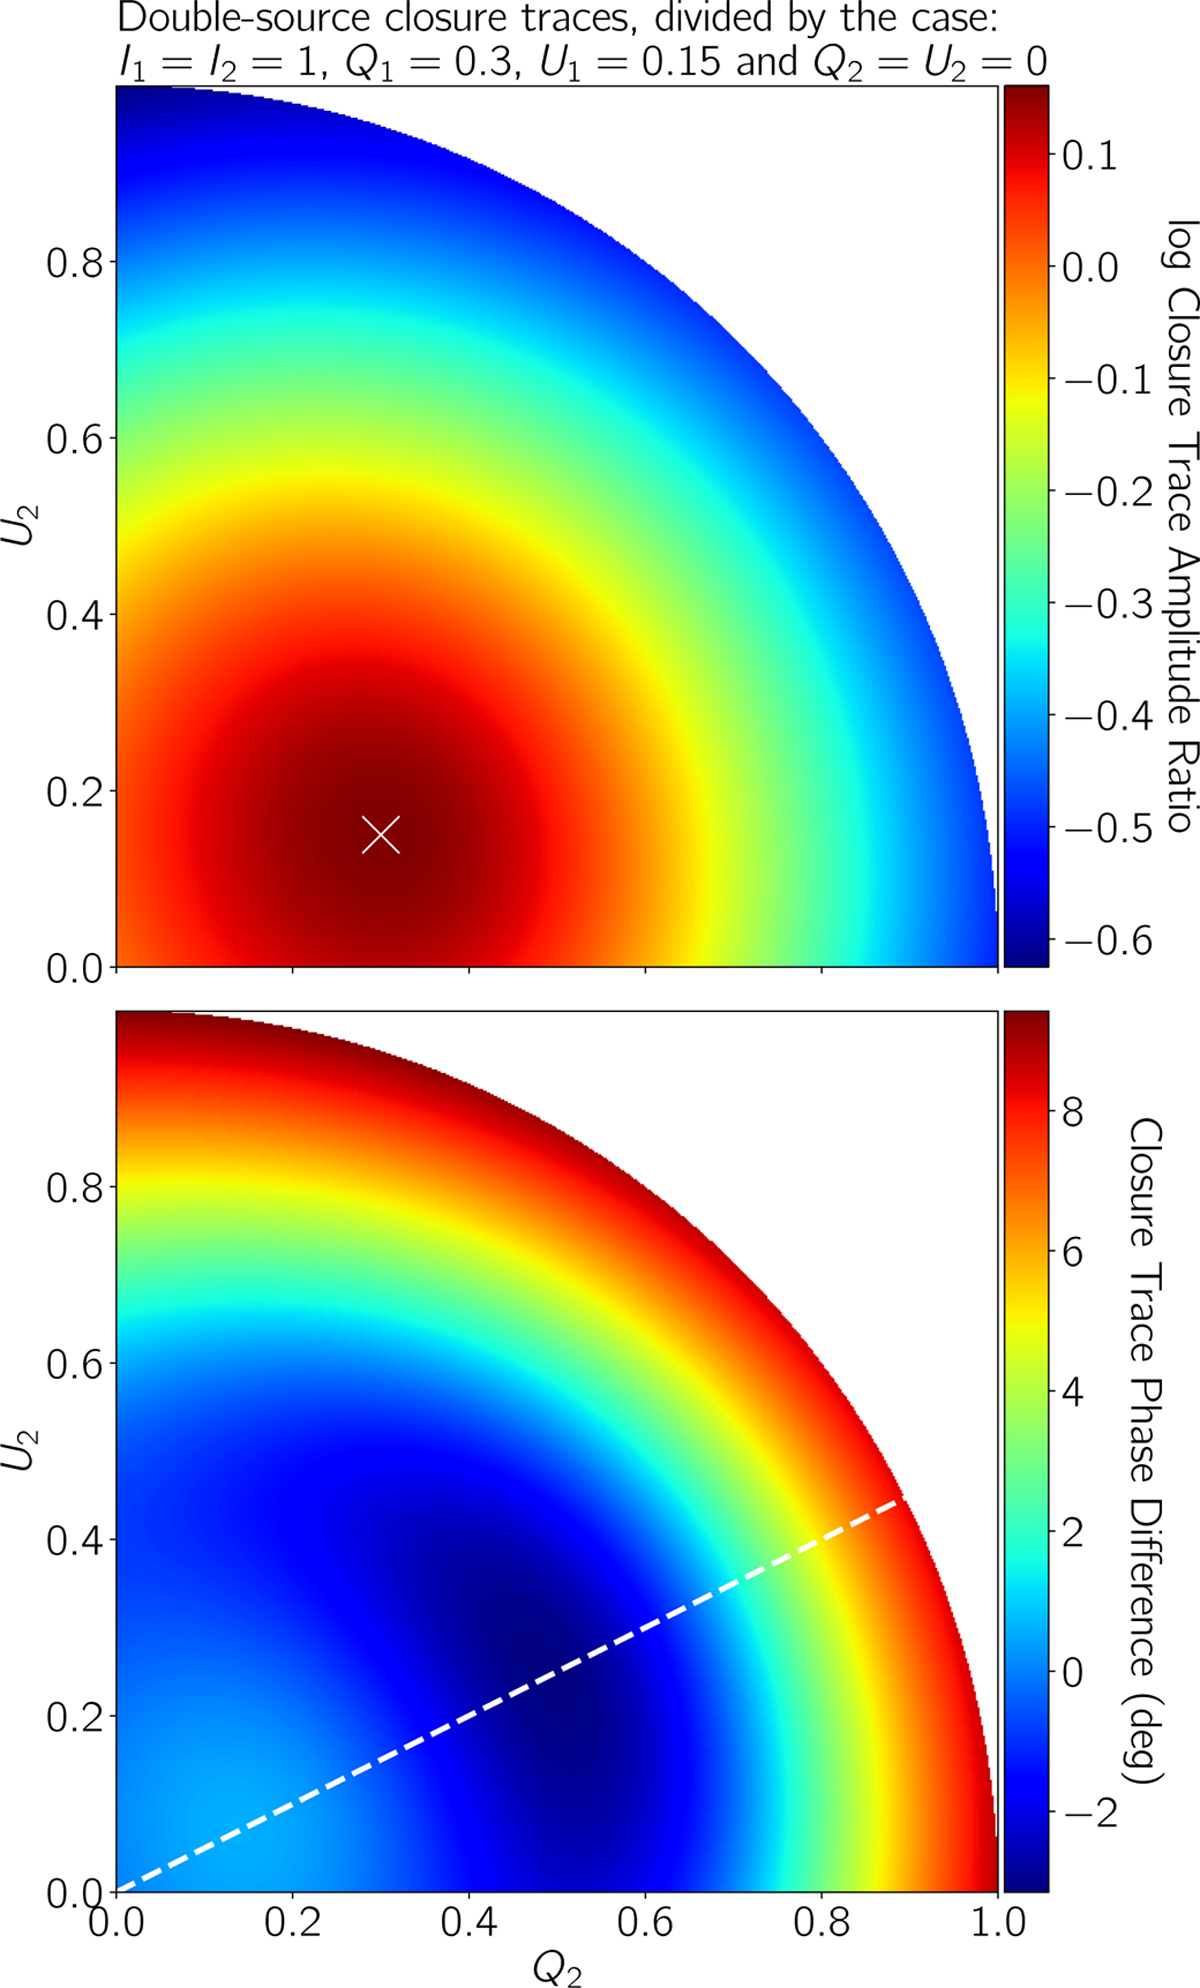
Mapping of the closure trace phase difference and amplitude ratio of a double source, for different values of the Stokes parameters Q2 and U2, taking the trace of the double source with Q2 = U2 = 0 (i.e., unpolarized component 2) as the reference trace. The antennas are distributed in the positions {A; B; C; D} → {0; 1; 4; 6}, in units of wave-length λ for a source separation of 1.3 radian. The white cross in the top panel marks the values of Q2 and U2 for which we get the maximum closure-trace amplitude ratio. On the other hand, the dashed line in the bottom panel marks the locus of points for which the electric vector position angle (EVPA) of component 1 and component 2 is aligned.
Current usage metrics show cumulative count of Article Views (full-text article views including HTML views, PDF and ePub downloads, according to the available data) and Abstracts Views on Vision4Press platform.
Data correspond to usage on the plateform after 2015. The current usage metrics is available 48-96 hours after online publication and is updated daily on week days.
Initial download of the metrics may take a while.