Fig. 1
Download original image
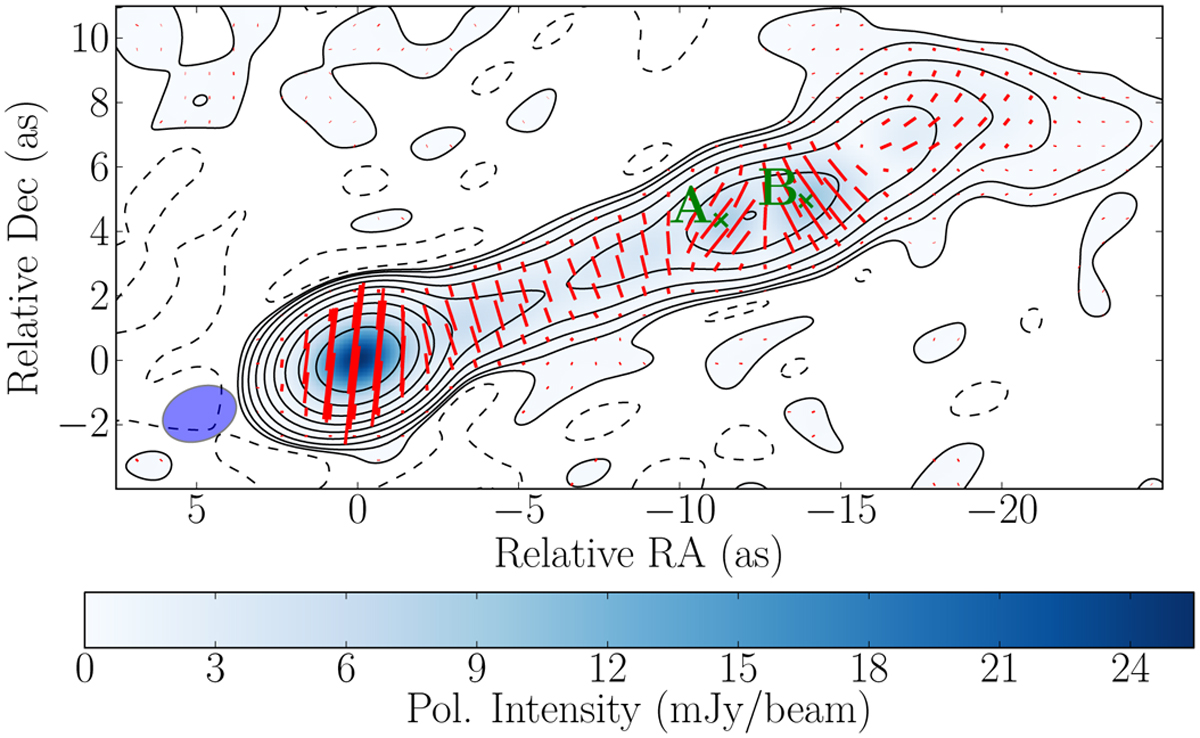
Image of the polarization structure of the AGN in galaxy M87. The blue scale corresponds to the mapping of the linear polarization intensity. The red lines show the EVPA, with lengths proportional to the polarization intensity. The contours quantify the total intensity (Stokes I). The contours are spaced logarithmically between the image peak (1.21 Jy beam−1) and 0.325 mJy beam−1, which corresponds to the root-mean-squared (rms) of the image residuals. The dashed contour marks the first negative contour in total intensity, at -0.325 mJy beam−1. The full width at half maximum (FWHM) of the convolving Gaussian beam is shown at the bottom-left corner. An alternative version of this figure can be found in Goddi et al. (2021).
Current usage metrics show cumulative count of Article Views (full-text article views including HTML views, PDF and ePub downloads, according to the available data) and Abstracts Views on Vision4Press platform.
Data correspond to usage on the plateform after 2015. The current usage metrics is available 48-96 hours after online publication and is updated daily on week days.
Initial download of the metrics may take a while.