Fig. 9.
Download original image
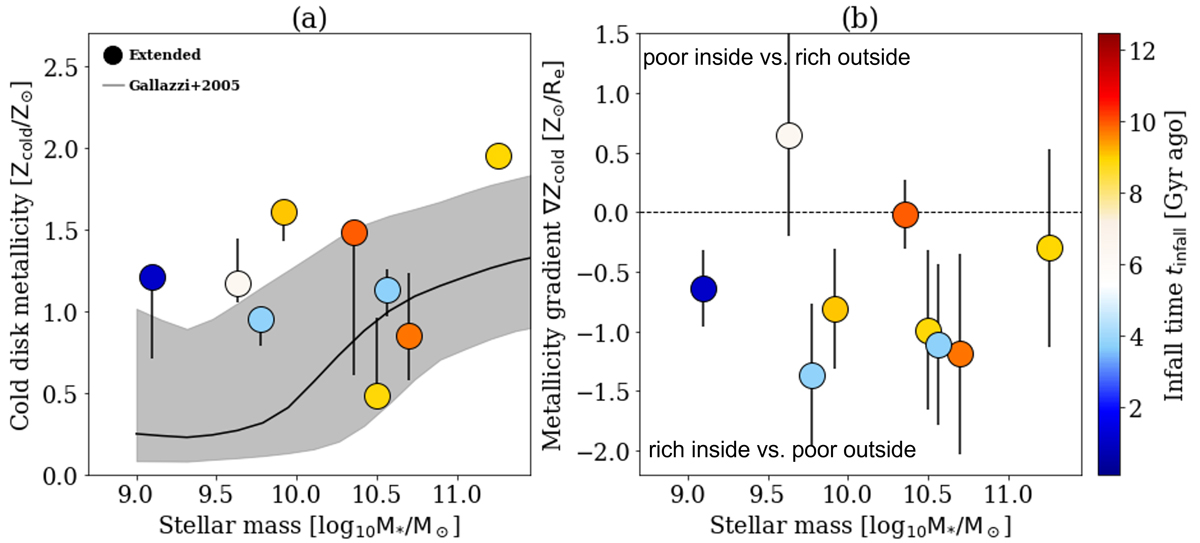
Mean metallicity (left panel) and metallicity gradient (right panel) of the extended cold disks in the sample galaxies as a function of stellar mass and infall time into the Fornax Cluster. The black curve and gray shadow represent the metallicity–stellar mass relation and the 1σ uncertainty for the galaxies in Gallazzi et al. (2005). Symbols are same as Fig. 8.
Current usage metrics show cumulative count of Article Views (full-text article views including HTML views, PDF and ePub downloads, according to the available data) and Abstracts Views on Vision4Press platform.
Data correspond to usage on the plateform after 2015. The current usage metrics is available 48-96 hours after online publication and is updated daily on week days.
Initial download of the metrics may take a while.