Fig. 5.
Download original image
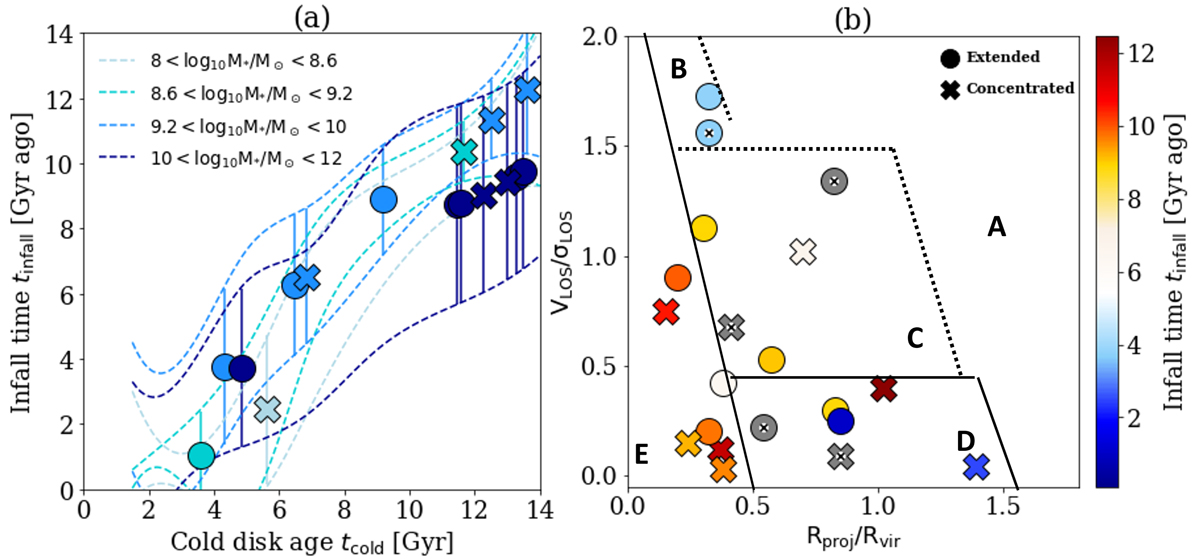
Infall time into the Fornax cluster of the sample galaxies for which we obtained the age of the dynamically cold disk. Left panel: correlation between the galaxy infall time tinfall and age of the dynamically cold disk tcold for four different mass bins: 8 < log M*/M⊙ < 8.6 (light cyan), 8.6 < log M*/M⊙ < 9.2 (cyan), 9.2 < log M*/M⊙ < 10 (blue), and 10 < log M*/M⊙ < 12 (dark blue). Dashed lines mark the 1σ confidence limits of each correlation. Circles and crosses correspond to galaxies with extended and concentrated dynamically cold disks, respectively. Each galaxy is plotted by the age of its dynamically cold disk and infall time given by the median of the correlation corresponding to its stellar mass. The error bars corresponds to the 1σ uncertainty of the infall time inferred from the correlation. Right panel: distribution of the left-panel galaxies in the phase-space of the projected line-of-sight velocity of the galaxy normalized by line-of-sight velocity dispersion of the cluster VLOS/σLOS versus the projected clustercentric radius of the galaxy normalized by the cluster virial radius Rproj/Rvir. Each galaxy is color-coded according to its infall time except for the 4 LTGs without age and metallicity information shown in gray. The symbols are the same as in the left panel and the LTGs are marked by gray symbols. The boundaries of the regions A, B, C, D, and E are defined as in Rhee et al. (2017).
Current usage metrics show cumulative count of Article Views (full-text article views including HTML views, PDF and ePub downloads, according to the available data) and Abstracts Views on Vision4Press platform.
Data correspond to usage on the plateform after 2015. The current usage metrics is available 48-96 hours after online publication and is updated daily on week days.
Initial download of the metrics may take a while.