Fig. 5
Download original image
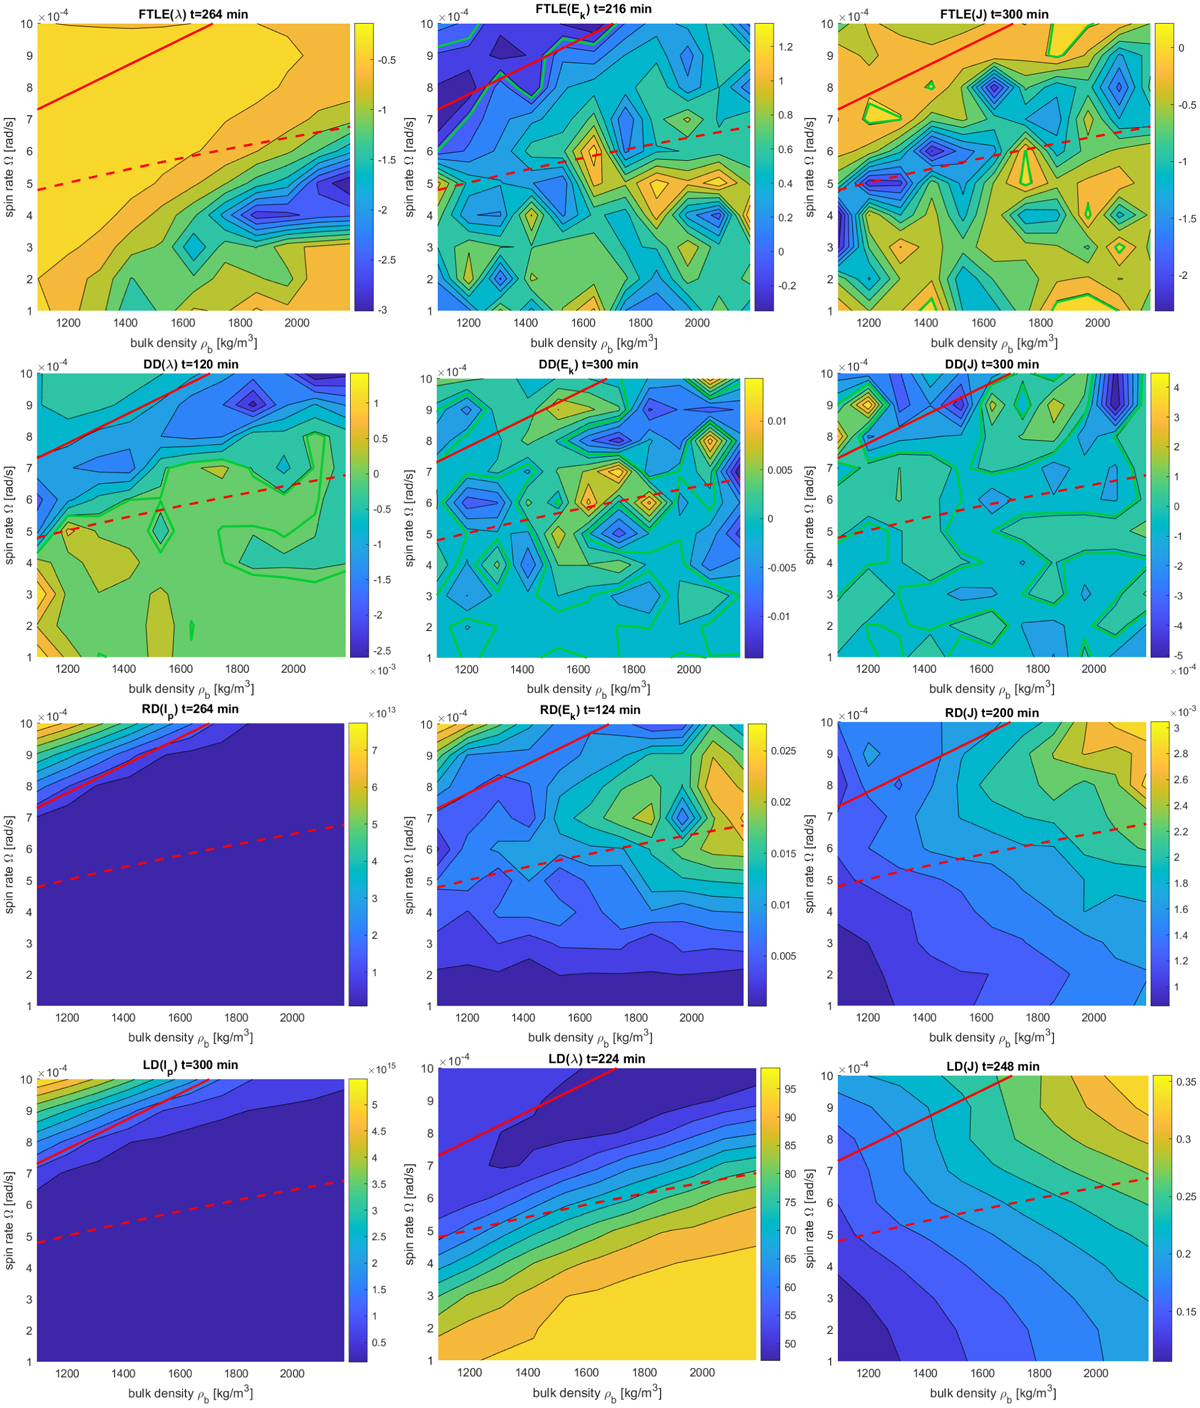
Maps of the configuration space for a spinning rubble-pile aggregate using different indicators. Final asymptotic maps are shown for all the cases. Maps with t = 300 min have not reached a stable asymptotic condition in this time frame and would require longer simulation times (or may never become stable). The solid red line indicates the breakup limit derived from granular N-body simulations (ground-truth reference), and the dashed red line indicates the theoretical equilibrium curve described by Eq. (3). The solid green line indicates level lines with FTLE(W) = 0 (FTLE cases) and DD(W) = 0 (DD cases).
Current usage metrics show cumulative count of Article Views (full-text article views including HTML views, PDF and ePub downloads, according to the available data) and Abstracts Views on Vision4Press platform.
Data correspond to usage on the plateform after 2015. The current usage metrics is available 48-96 hours after online publication and is updated daily on week days.
Initial download of the metrics may take a while.