Fig. 2
Download original image
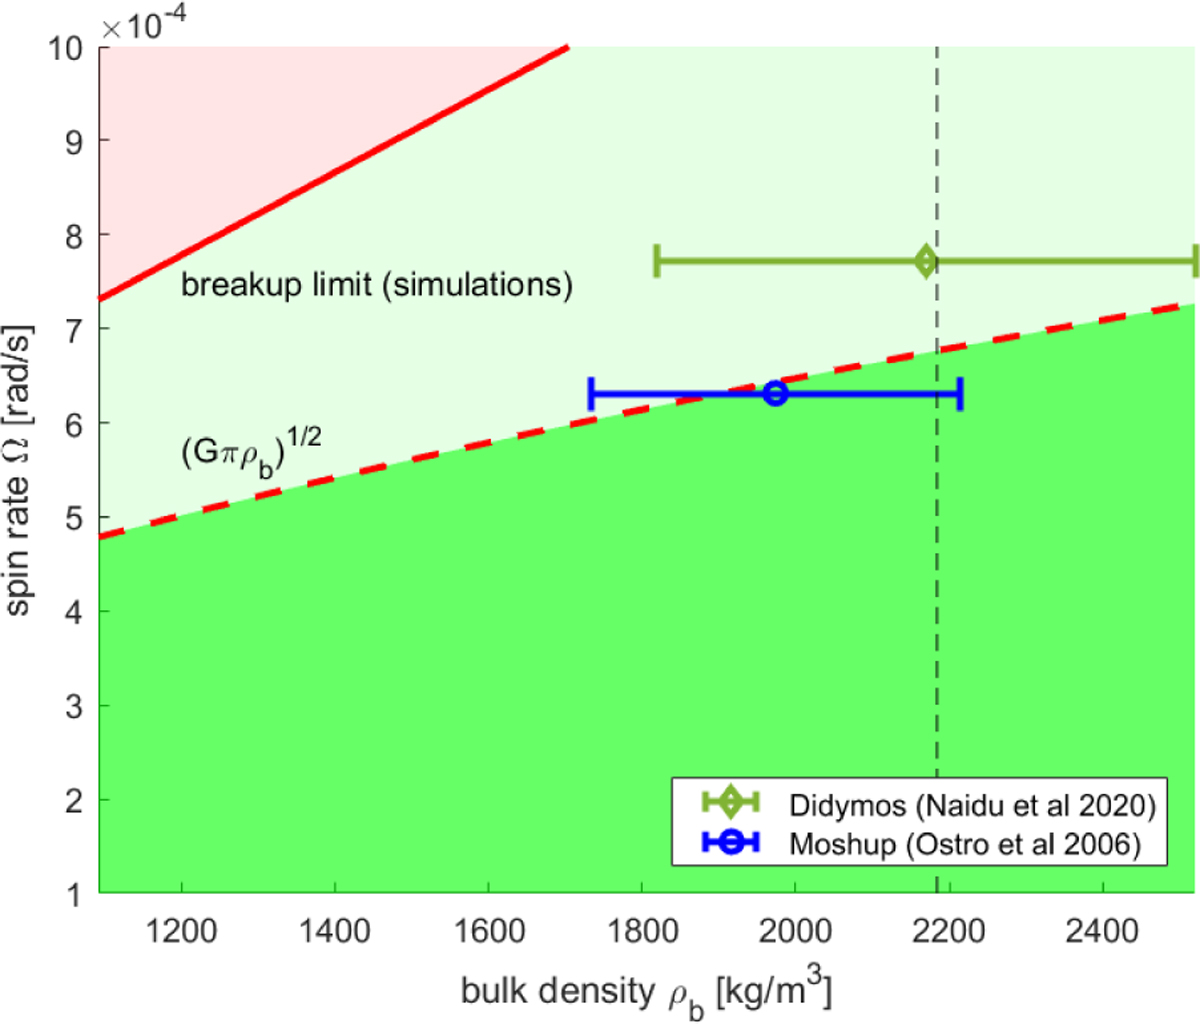
Stable, unstable, and breakup regions in the (ρb − Ω) parameter space. With reference to the numerical simulations performed in this work, green and red regions denote initial conditions forming nondis-rupted and disrupted aggregates, respectively. The breakup transition is marked by the solid red line, and the theoretical limit for equilibrium reported in Eq. (3) is represented by the dashed red line. The intermediate region between the theoretical equilibrium and the breakup lines (light green area) includes aggregates that are not in equilibrium, but that are able to reshape without breaking apart. The vertical dashed blackline reports the maximum ρb value used in simulations. For reference, we report current (ρb − Ω) estimates (and their uncertainty) for asteroids Didymos (Naidu et al. 2020) and Moshup (Ostro et al. 2006).
Current usage metrics show cumulative count of Article Views (full-text article views including HTML views, PDF and ePub downloads, according to the available data) and Abstracts Views on Vision4Press platform.
Data correspond to usage on the plateform after 2015. The current usage metrics is available 48-96 hours after online publication and is updated daily on week days.
Initial download of the metrics may take a while.