Fig. 5
Download original image
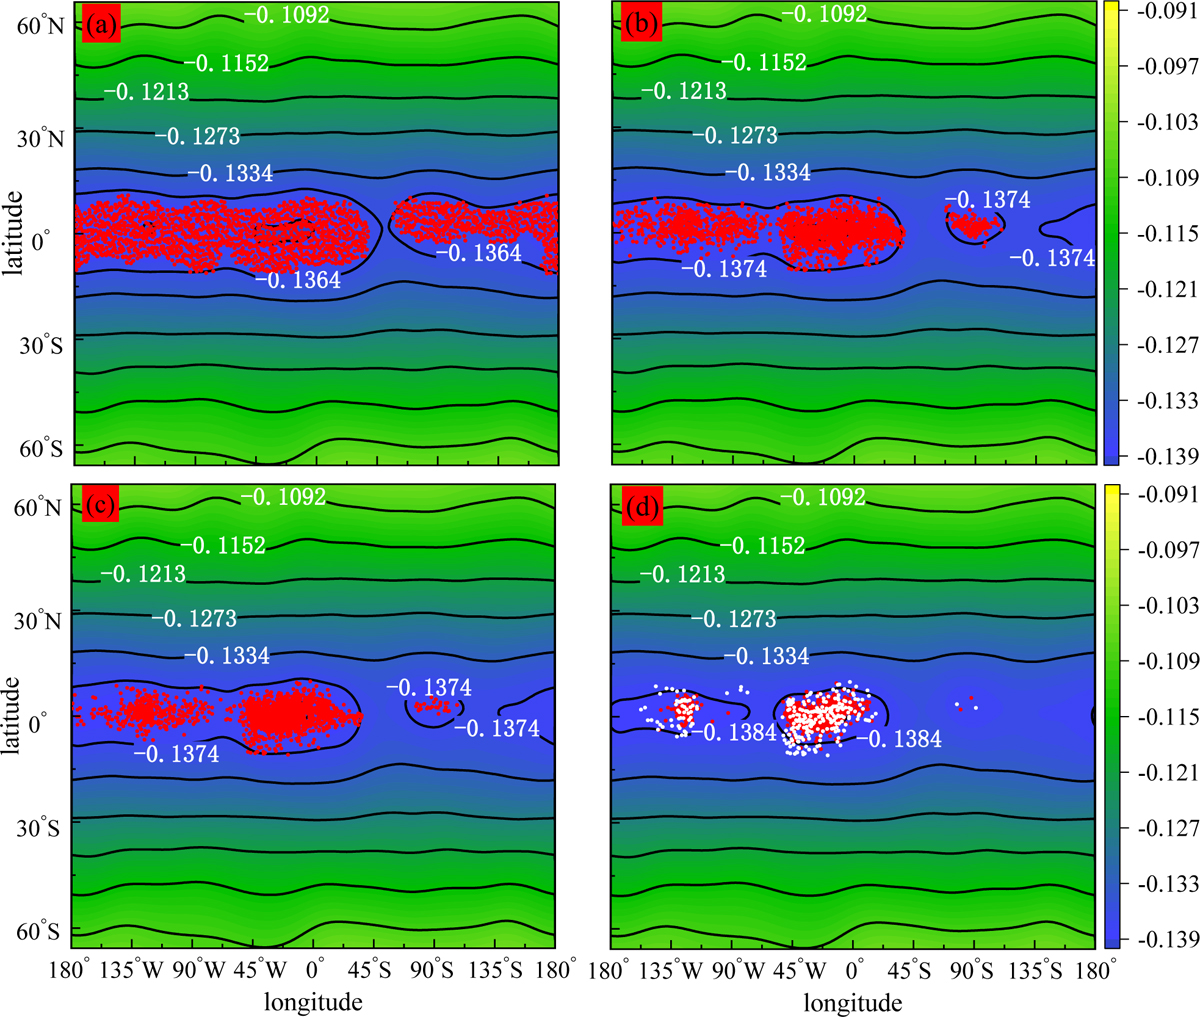
Evolution of collision sites with increasing number of collisions and the contour plot of the geopotential. The red points denote collision sites on the saltation routes, and the white points indicate the initial locations where particles directly enter orbit and no longer collide with the surface during the simulation. The black solid lines indicate the contour lines of the geopotential. The color spectrum (blue to yellow) corresponds to the geopotential ranging from −0.1398 to −0.091 J kg−1. Panels a, b, c, and d show the location distribution of particles at the initial moment, the first collision, the second collision, and the last collision, respectively.
Current usage metrics show cumulative count of Article Views (full-text article views including HTML views, PDF and ePub downloads, according to the available data) and Abstracts Views on Vision4Press platform.
Data correspond to usage on the plateform after 2015. The current usage metrics is available 48-96 hours after online publication and is updated daily on week days.
Initial download of the metrics may take a while.