Fig. 4
Download original image
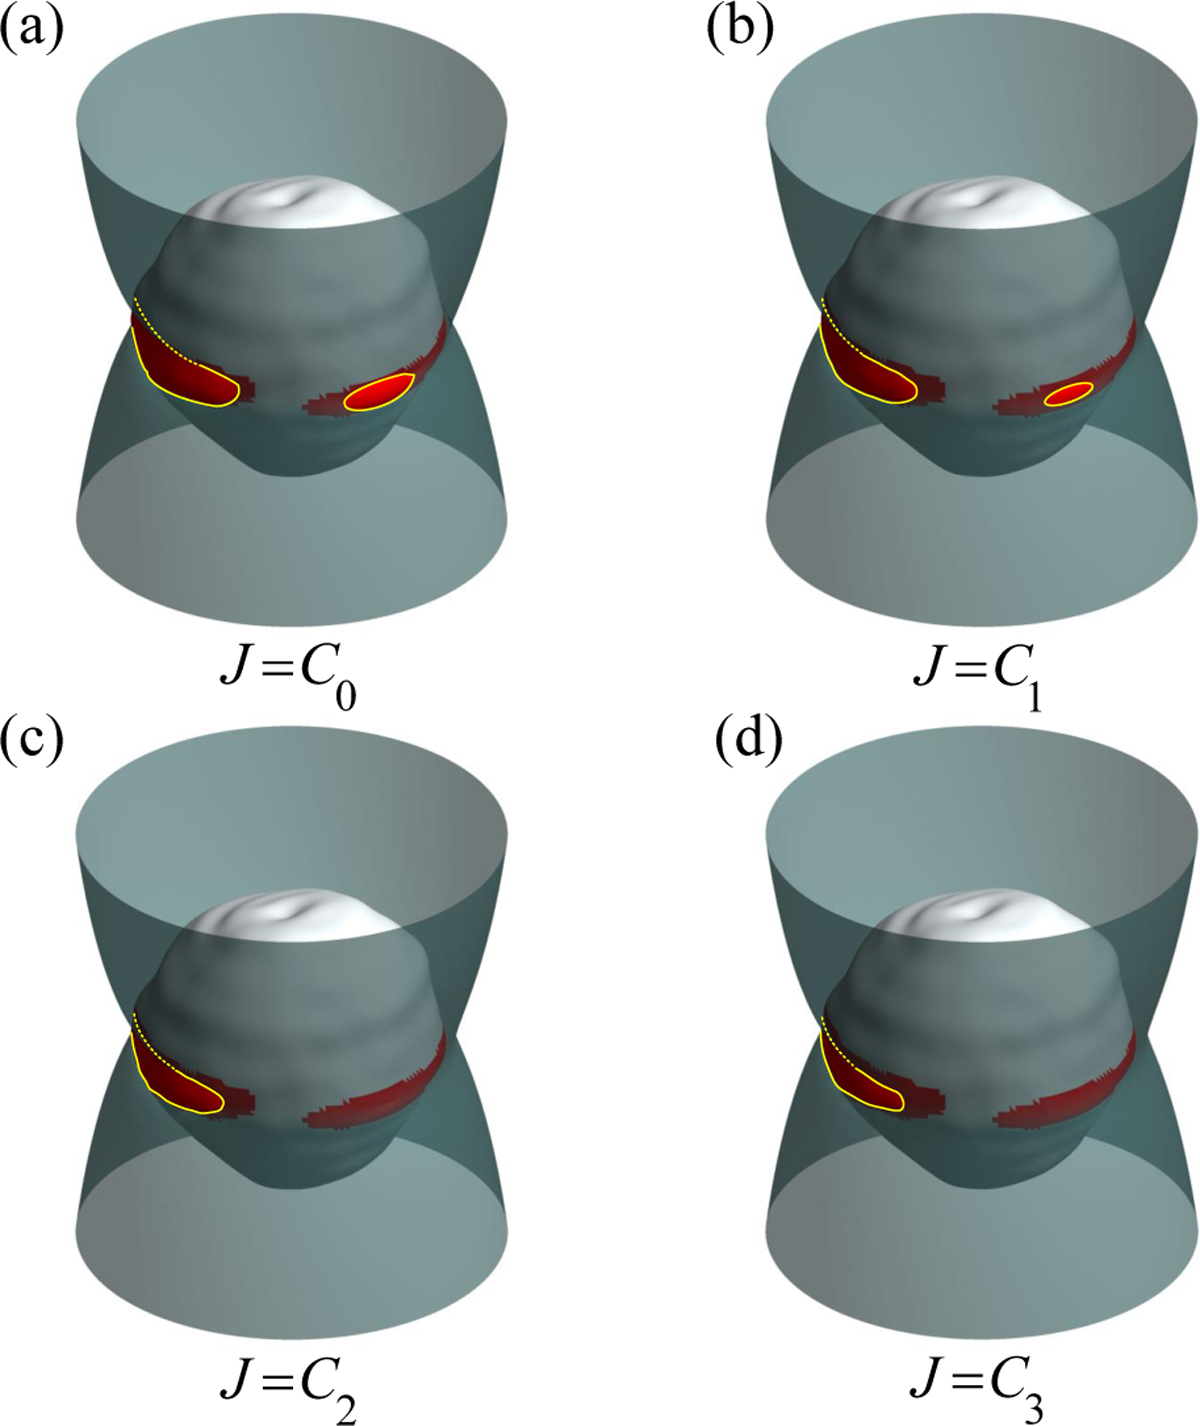
Evolution of allowable regions on the surface of the asteroid caused by three collisions. The value of C0 = −0.1377 J kg−1 corresponds to the Jacobi integral of the particle at the initial moment, whereas C1 = −0.1381 J kg−1 C2 = −0.1384 J kg−1 and C3 = −0.1387 J kg−1 correspond to its Jacobi integral after three collisions, respectively. The semi-transparent gray surface represents the zero-velocity surface, and the yellow line represents the intersection of the zero-velocity surface and the asteroid surface. The red region corresponds to the unstable region. Regions protruding out of the zero-velocity surface and encompassed by yellow lines indicate the allowable regions on the surface of the asteroid.
Current usage metrics show cumulative count of Article Views (full-text article views including HTML views, PDF and ePub downloads, according to the available data) and Abstracts Views on Vision4Press platform.
Data correspond to usage on the plateform after 2015. The current usage metrics is available 48-96 hours after online publication and is updated daily on week days.
Initial download of the metrics may take a while.