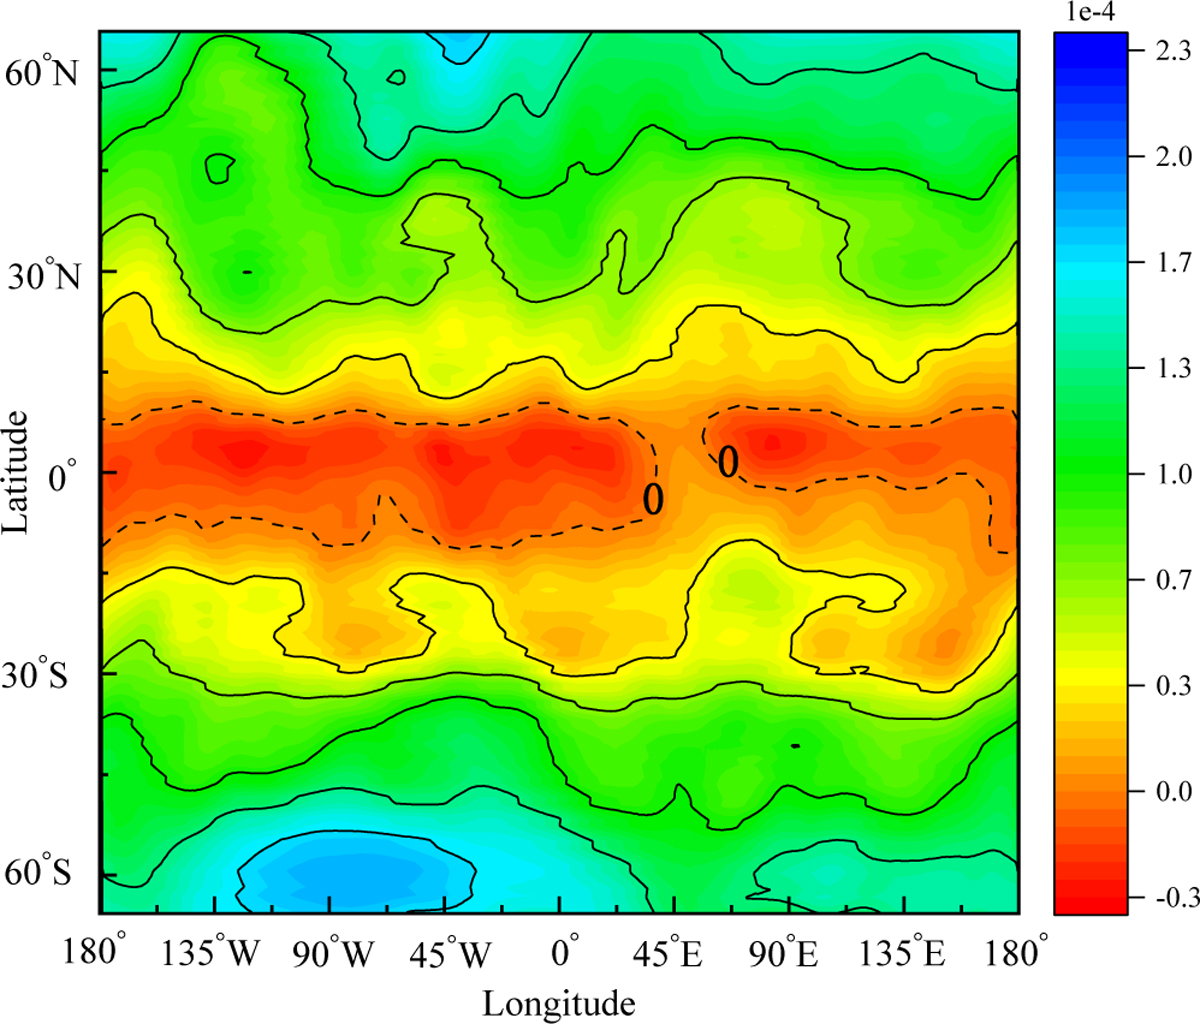
Fig. 2
Download original image
Solutions of the unstable regions of Didymos. The full color spectrum corresponds to the minimum to maximum values of l as defined in Eq. (1). The red color represents the unstable region l ⩽ 0, and the blue color indicates the stable regions l ⩾ 0. The solid curves indicate the contour lines of the value of l, and the dashed curves indicate that the value of l = 0, which corresponds to balanced, normal components of the gravitational and centrifugal forces.
Current usage metrics show cumulative count of Article Views (full-text article views including HTML views, PDF and ePub downloads, according to the available data) and Abstracts Views on Vision4Press platform.
Data correspond to usage on the plateform after 2015. The current usage metrics is available 48-96 hours after online publication and is updated daily on week days.
Initial download of the metrics may take a while.