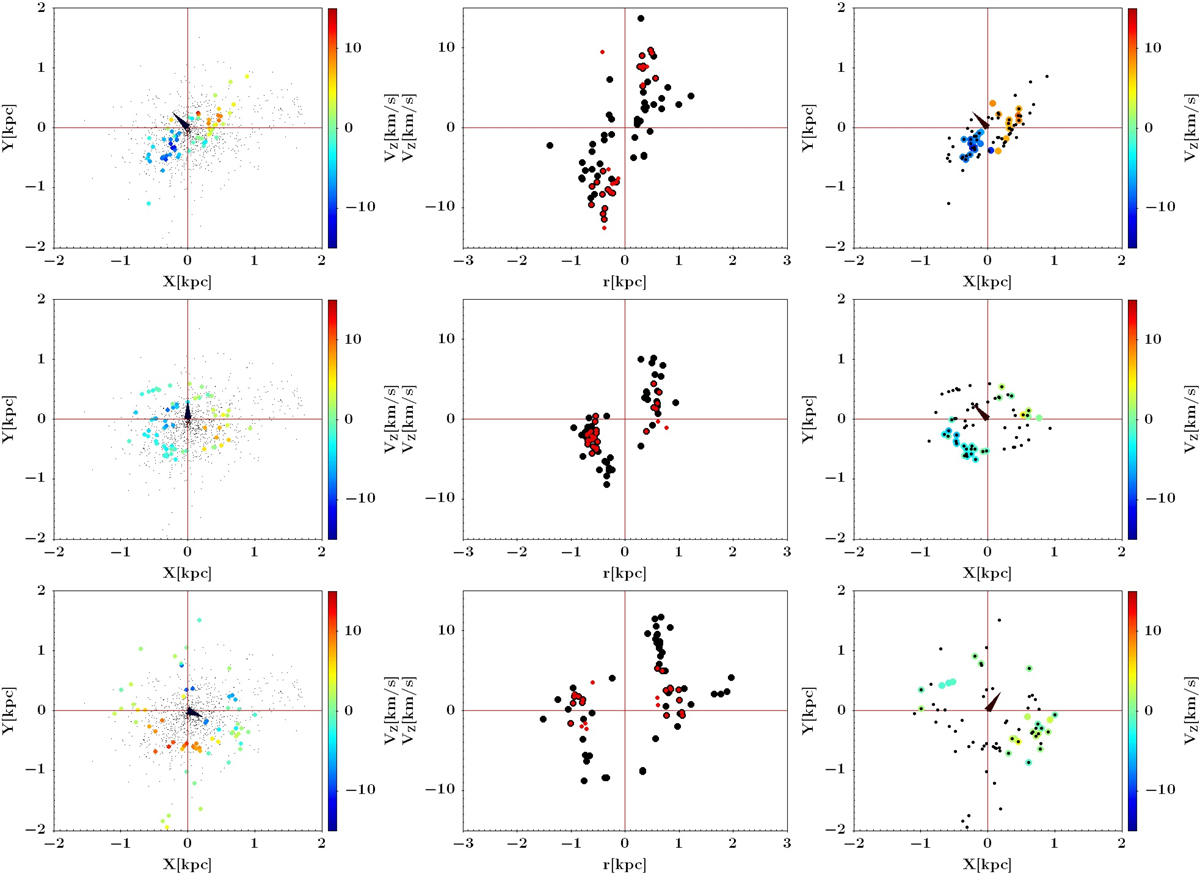
Fig. 4.
Download original image
An example of how BEACON can extract substructures hidden in a large data set with 992 particles. Here we apply BEACON to a simulation of dissolving star clusters with 16 star clusters and a constant star formation. The left panels show the position of the stars and the velocities along the z-axis are shown as colours for the stars that were formed in the same star cluster. The black triangles show the projected angular momentum direction and black dots are all other particles from the simulation. Middle panels show the velocities along the line of sight taking as a new y-axis the projected angular momentum direction, black dots are the values for the stars which belong to the same star cluster and red dots are the stars recovered by BEACON. In the right panels we show the particles recovered by BEACON in colour and in black the stars which belong to the same star cluster. In these examples BEACON was able to recover most of the stars which show a strong rotation signal, with a few false detected stars which do not belong to the star cluster.
Current usage metrics show cumulative count of Article Views (full-text article views including HTML views, PDF and ePub downloads, according to the available data) and Abstracts Views on Vision4Press platform.
Data correspond to usage on the plateform after 2015. The current usage metrics is available 48-96 hours after online publication and is updated daily on week days.
Initial download of the metrics may take a while.